

For the second time this year, we have a new record for the largest IPO in history. Anthropic raised more than $80 billion at a valuation of roughly $1.5 trillion, per CNN. The level and speed of wealth creation from the AI labs is unparalleled. Amid a generational technological revolution, tech stocks now trade at the same price-to-earnings ratio they hit at the pandemic low. Fund managers are getting skittish, though so far there’s little data to support the bad vibes. Chips are the new oil. Have you noticed more tech disruptions lately?
1. We’ve never seen anything like this before:
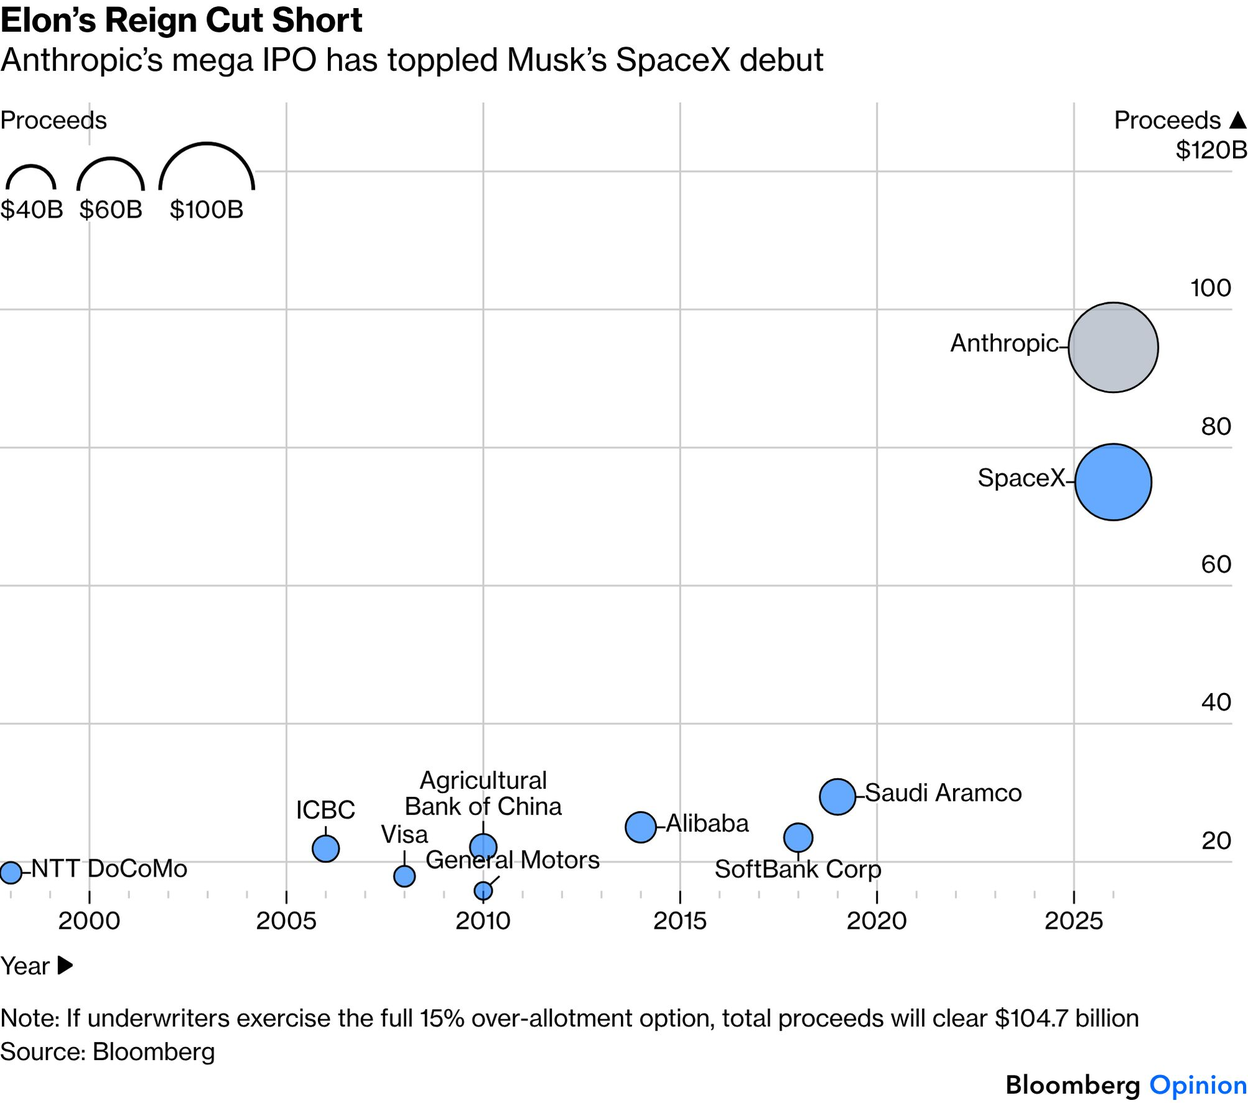 Source: John Authers, Points of Return on 11/19/2026
2. On paper, Anthropic’s roughly 5,300 founders and employees are now worth as much as the bottom third of U.S. households:
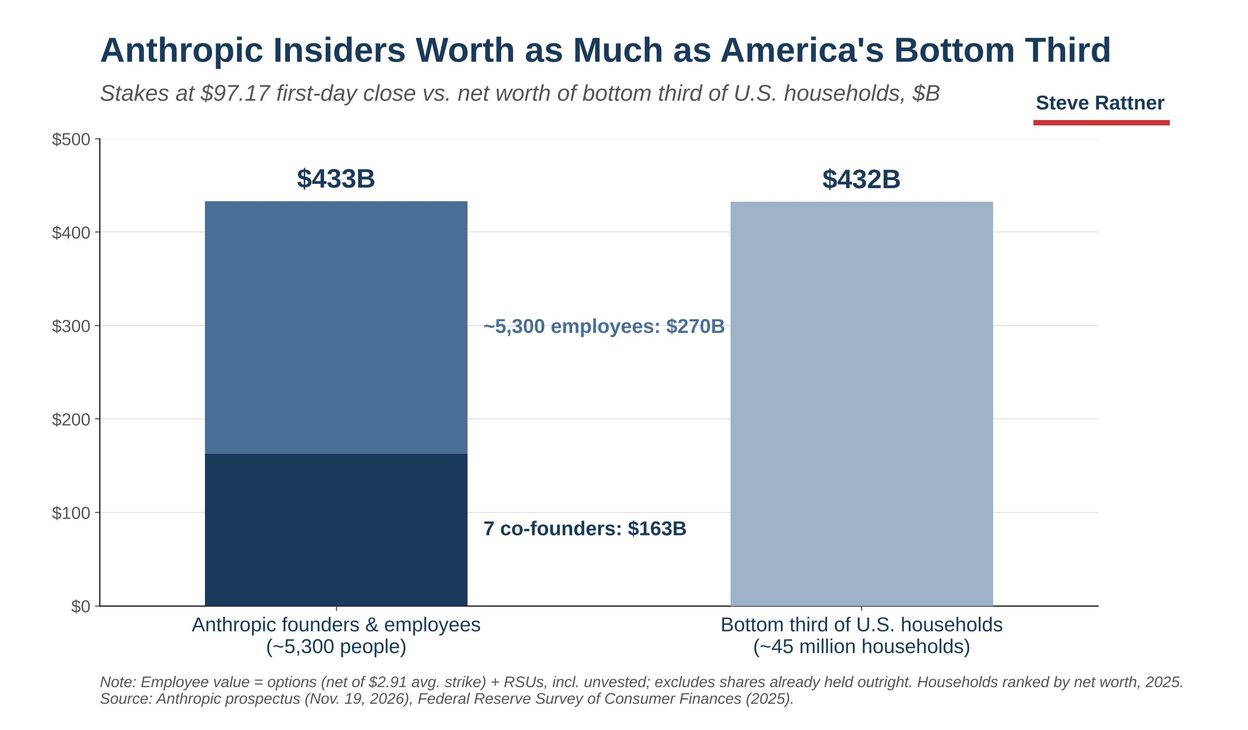 Source: @SteveRattner
3. U.S. IPO volume is now at a record, well past the 2021 peak:
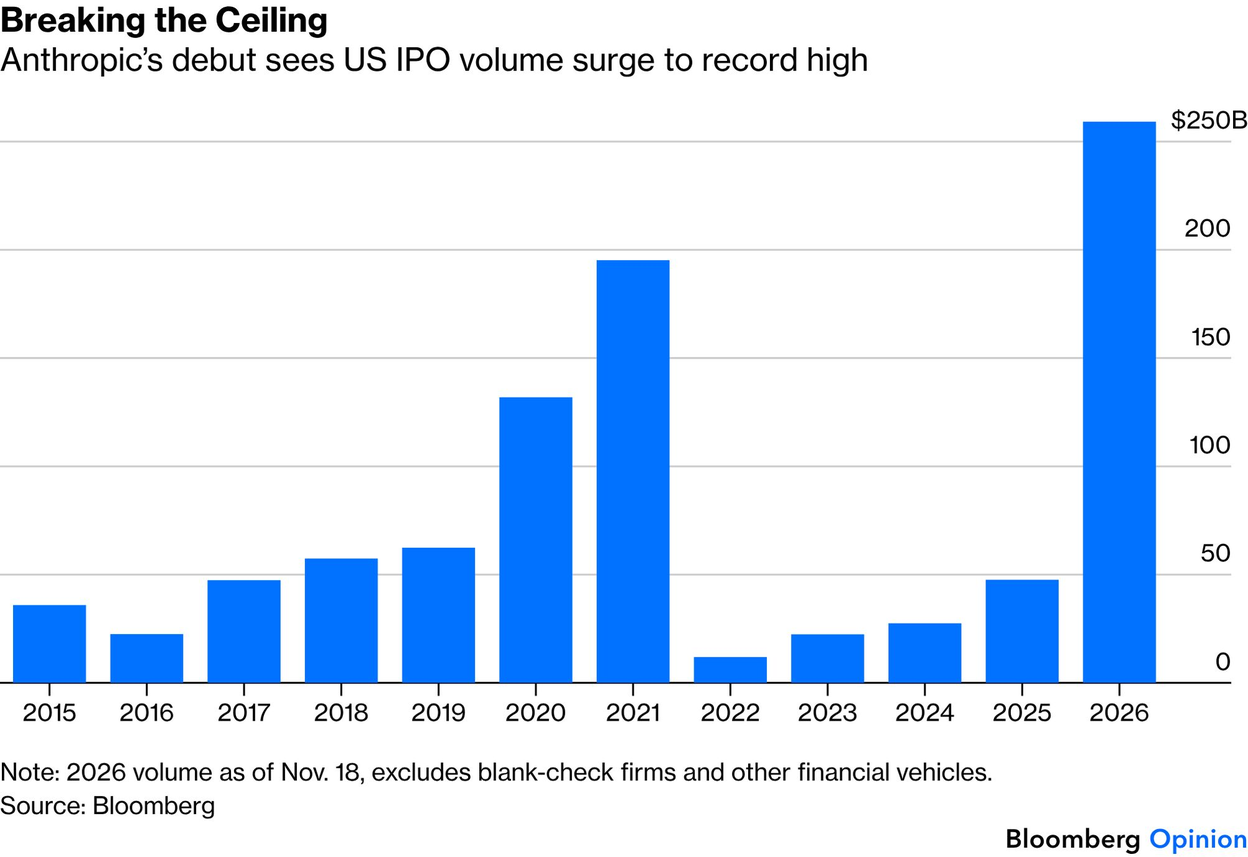 Source: John Authers, Points of Return on 11/19/2026
4. Putting any issues with the earnings aside, I think it’s unlikely that the tech sector trades at a below-market multiple long term:
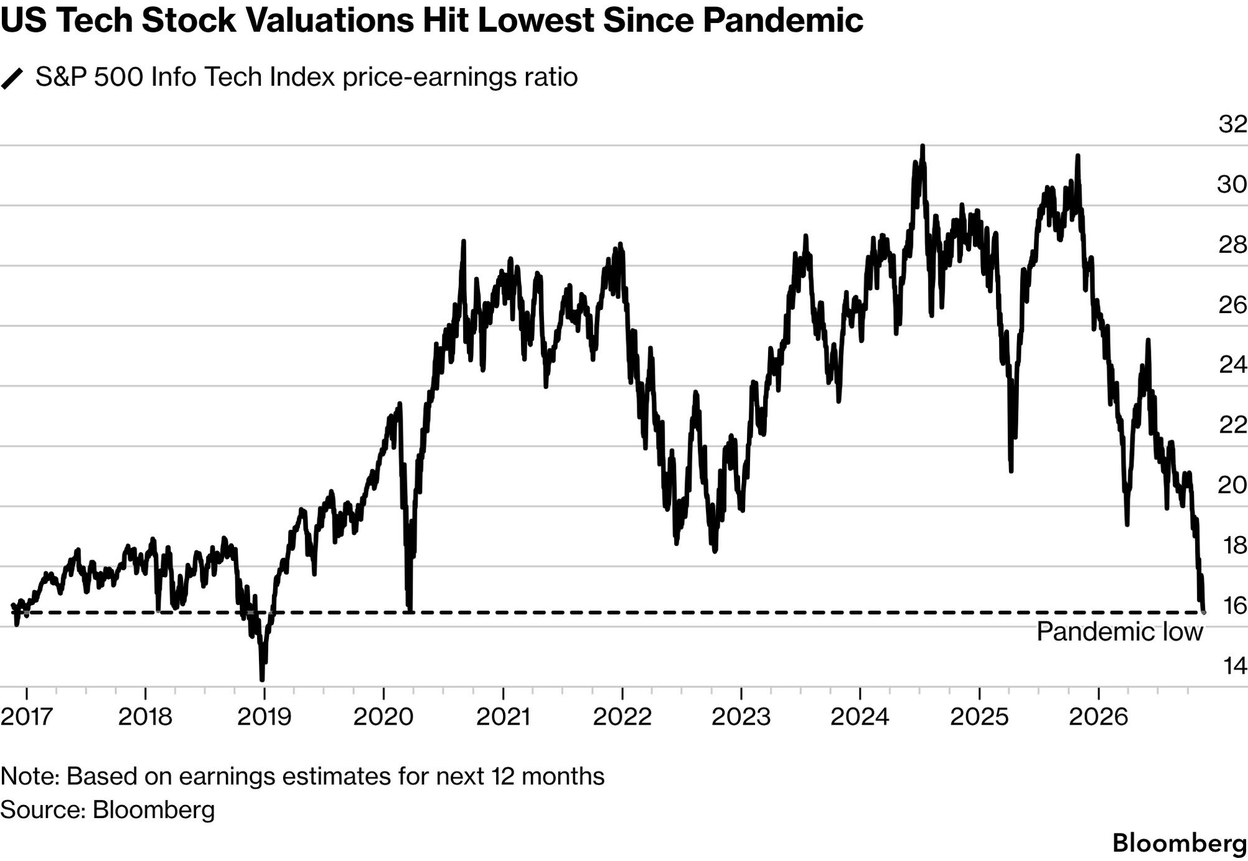 Source: Bloomberg Markets Daily on 11/19/2026
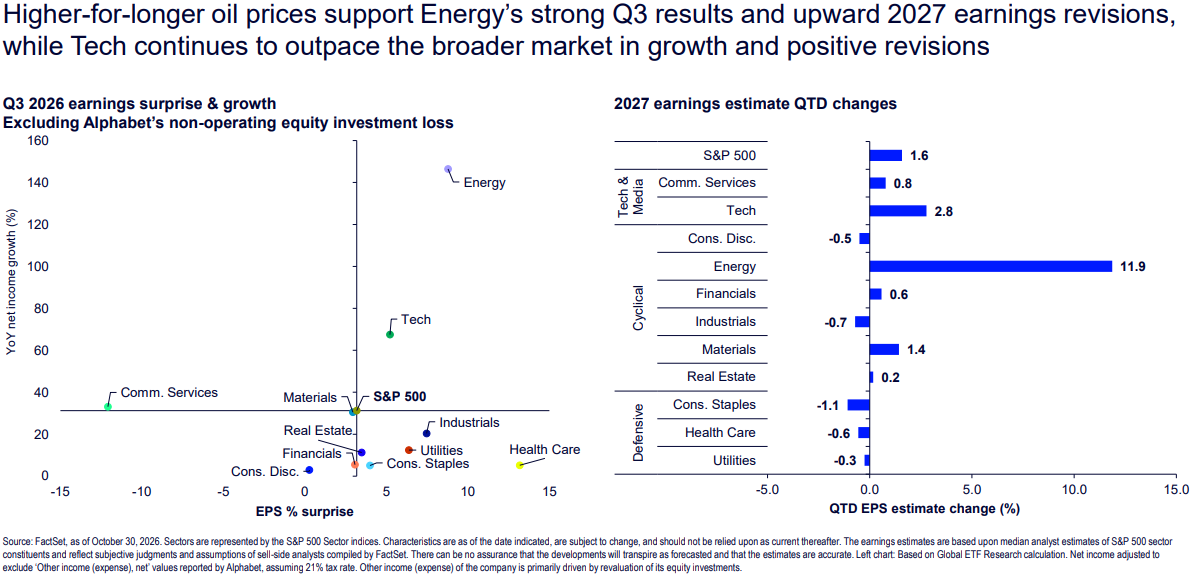
5. Analysts are still raising their 2027 earnings estimates for tech:
 Source: State Street Investment Management Chart Pack, November 2026 edition
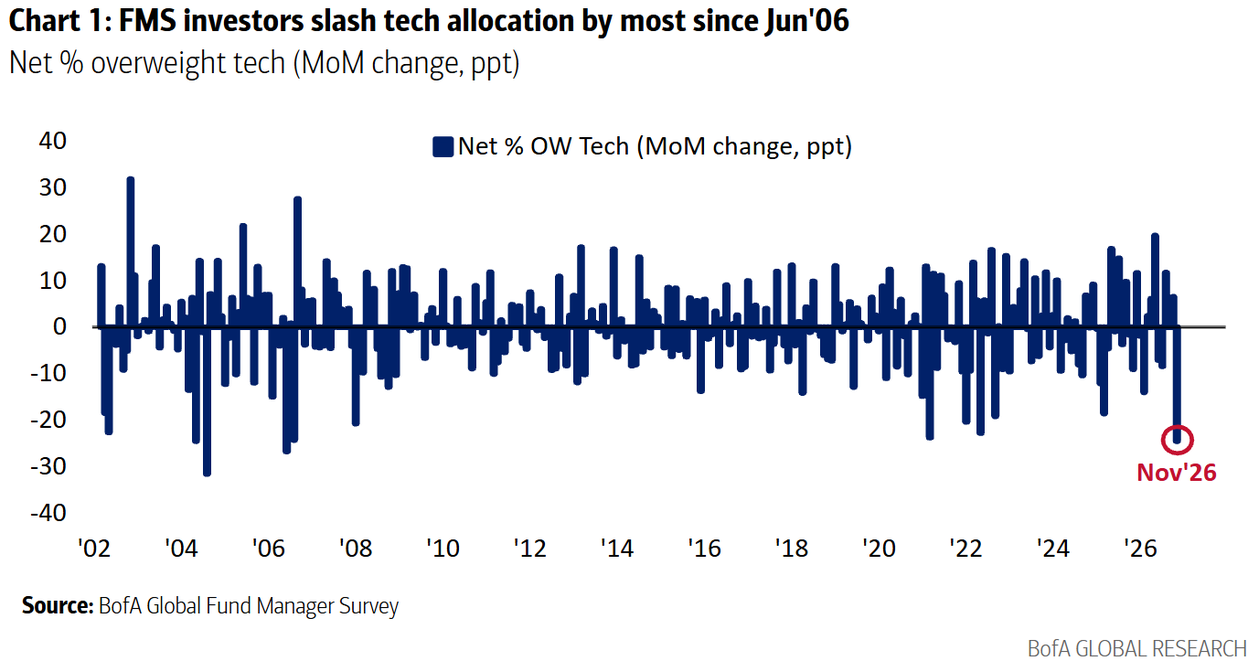
6. Fund managers are bailing on tech:
 Source: John Authers, Points of Return on 11/17/2026
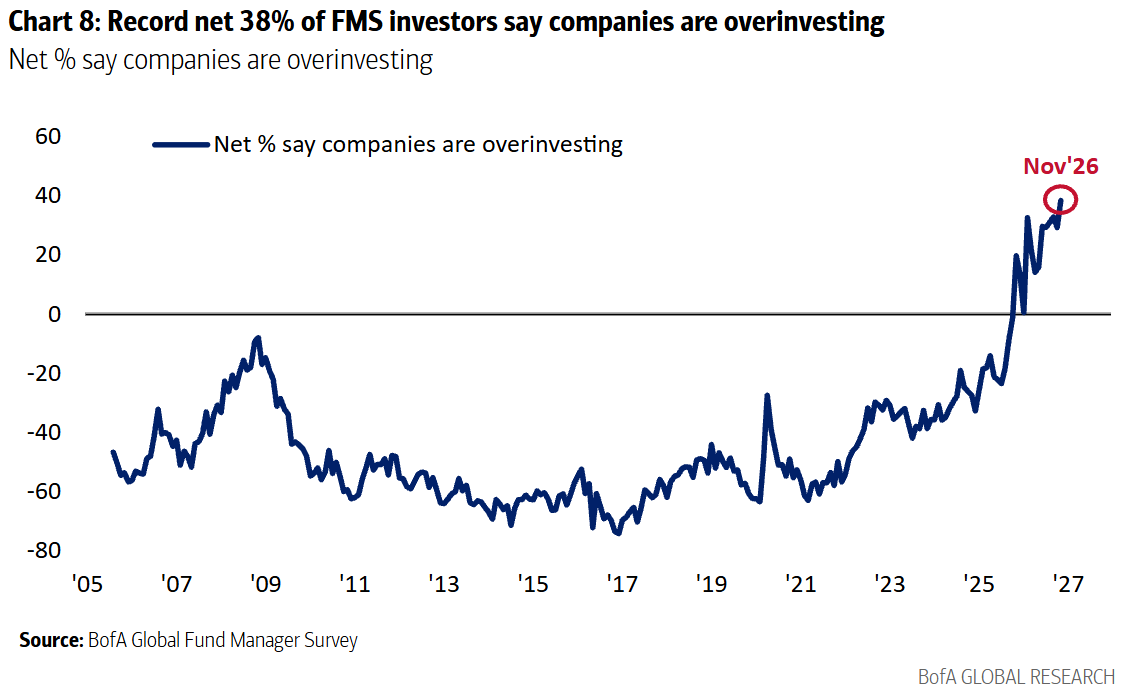
7. It’s becoming consensus that companies are overinvesting:
 Source: John Authers, Points of Return on 11/17/2026
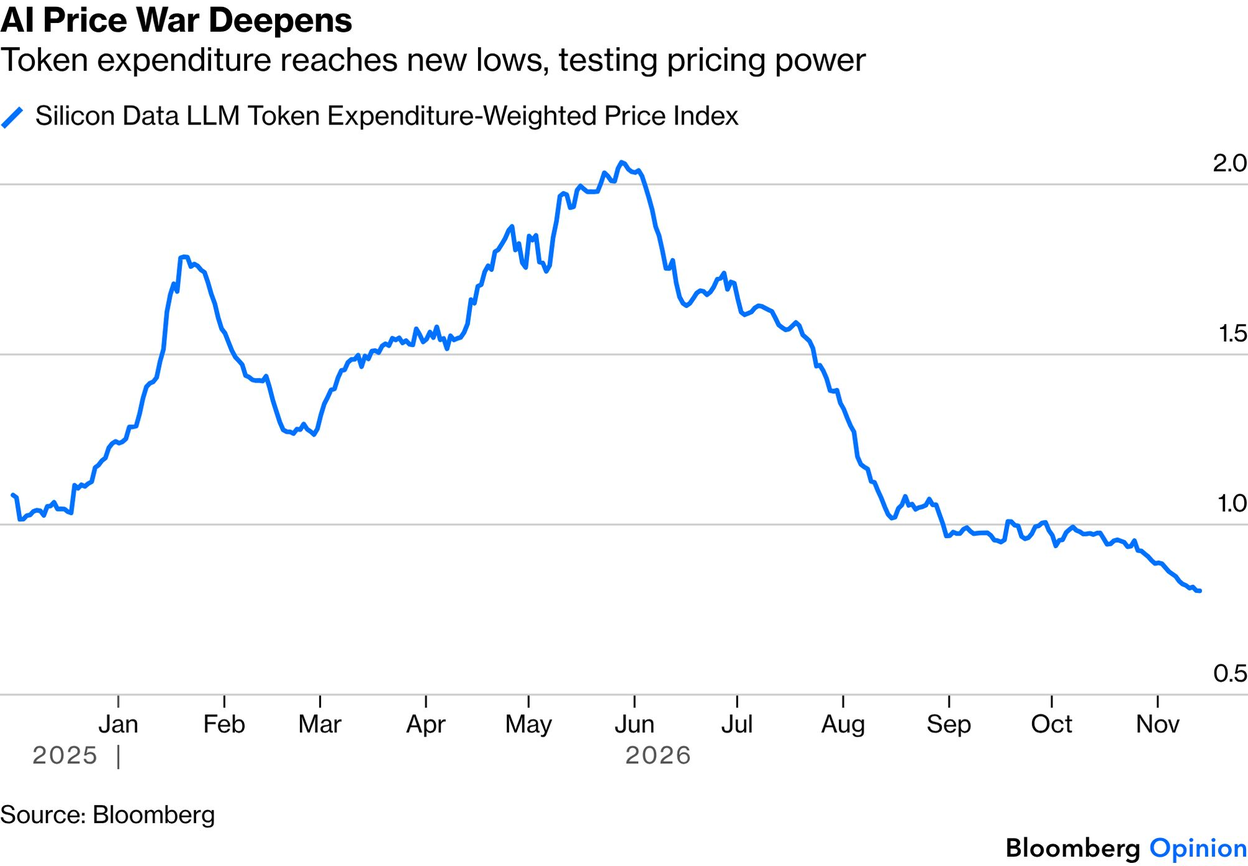
8. The price of AI tokens keeps hitting new lows:
 Source: John Authers, Points of Return on 11/16/2026
9. But demand for compute remains very tight in the near term:
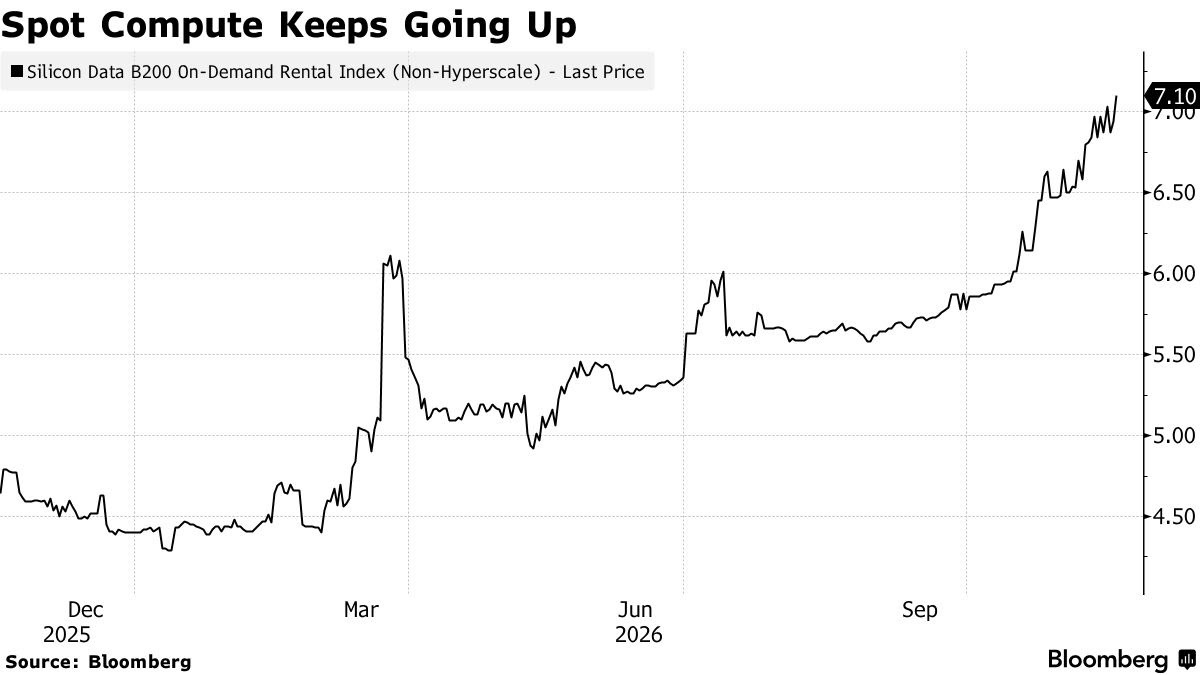 Source: Bloomberg Odd Lots on 11/18/2026
10. Domestic stocks have a small lead so far in 2026. Will 2027 finally be the year for international stocks?
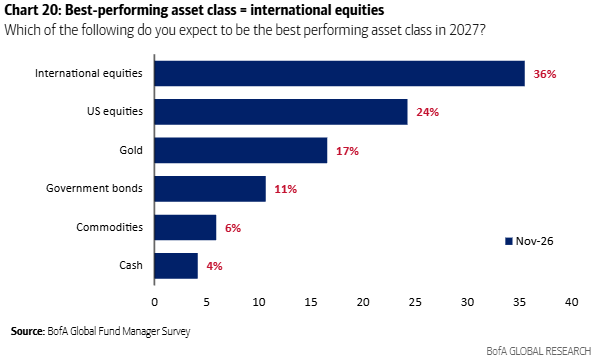 Source: John Authers, Points of Return on 11/17/2026
11. Semiconductors have become one of the world’s most important and influential exports:
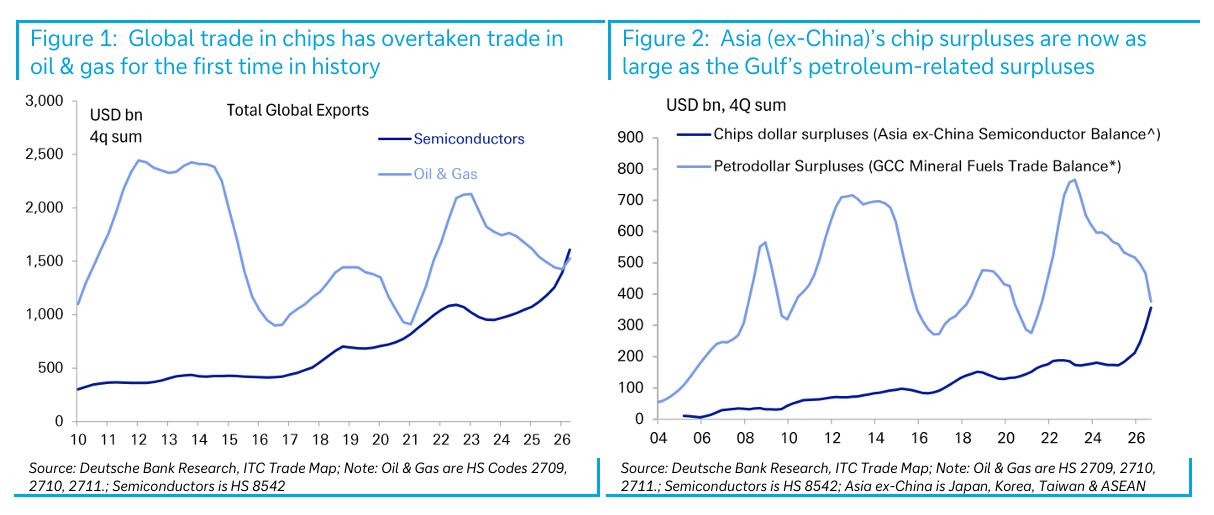 Source: Deutsche Bank via Bloomberg Odd Lots
12. Chip surpluses are being recycled into U.S. stocks, not Treasuries:
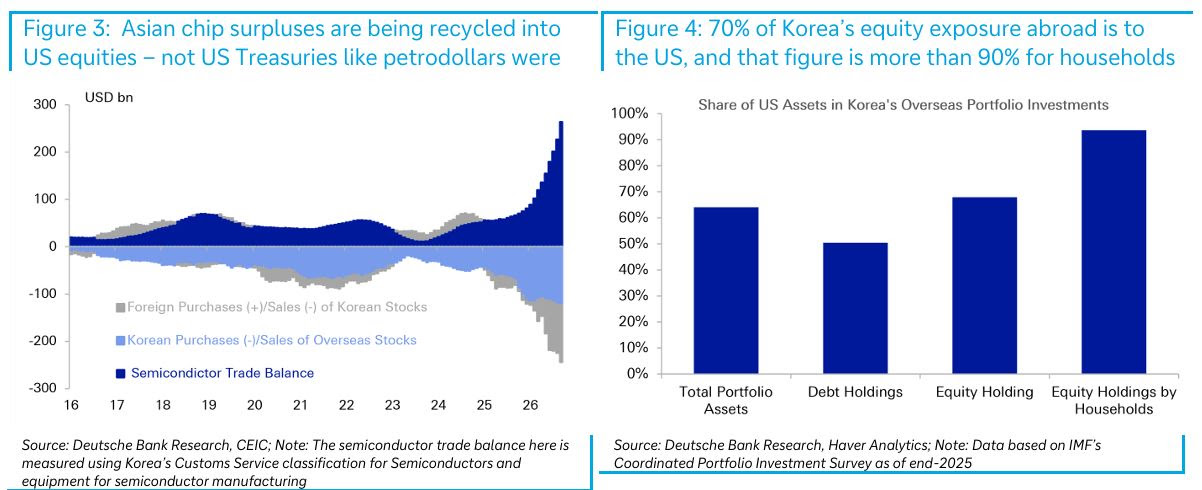 Source: Deutsche Bank via Bloomberg Odd Lots
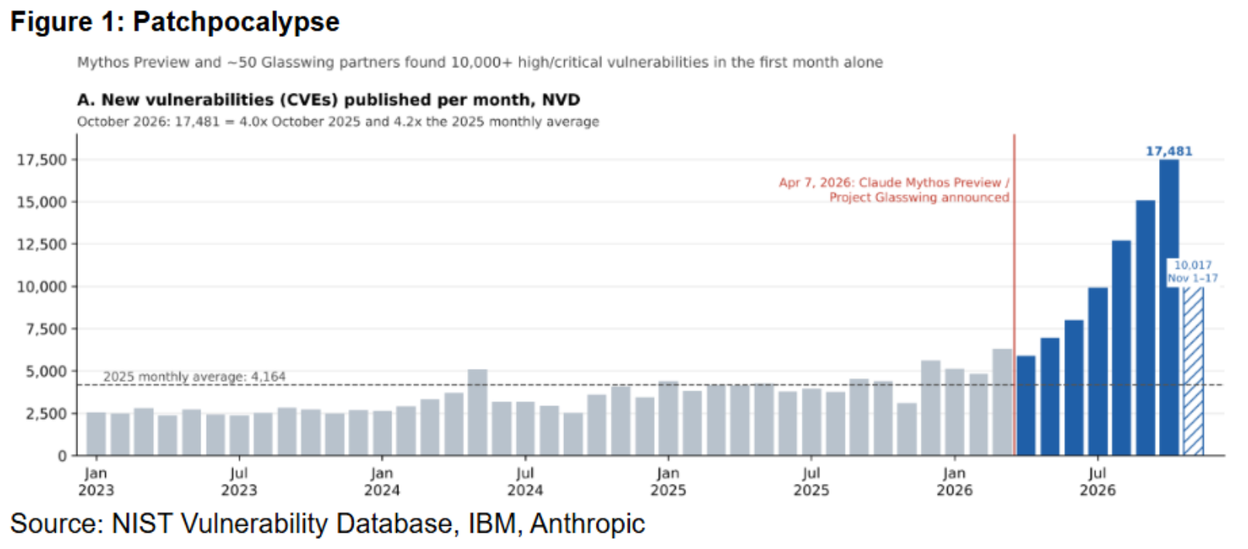
13. Be kind to your IT department:
 Source: Ben Emons via Bloomberg Odd Lots on 11/18/2026
Disclosures:
Copyright © 2026 Algorithmic Investment Models LLC (AIM). All rights reserved. All materials appearing in this commentary are protected by copyright as a collective work or compilation under U.S. copyright laws and are the property of Algorithmic Investment Models. You may not copy, reproduce, publish, use, create derivative works, transmit, sell or in any way exploit any content, in whole or in part, in this commentary without express permission from Algorithmic Investment Models.
Certain information contained herein constitutes “forward-looking statements,” which can be identified by the use of forward-looking terminology such as “may,” “will,” “should,” “expect,” “anticipate,” “project,” “estimate,” “intend,” “continue,” or “believe,” or the negatives thereof or other variations thereon or comparable terminology. Due to various risks and uncertainties, actual events, results or actual performance may differ materially from those reflected or contemplated in such forward-looking statements. Nothing contained herein may be relied upon as a guarantee, promise, assurance or a representation as to the future.
This material is provided for informational purposes only and does not in any sense constitute a solicitation or offer for the purchase or sale of a specific security or other investment options, nor does it constitute investment advice for any person. The material may contain forward or backward-looking statements regarding intent, beliefs regarding current or past expectations. The views expressed are also subject to change based on market and other conditions. The information presented in this report is based on data obtained from third party sources. Although it is believed to be accurate, no representation or warranty is made as to its accuracy or completeness.
The charts and infographics contained in this blog are typically based on data obtained from third parties and are believed to be accurate. The commentary included is the opinion of the author and subject to change at any time. Any reference to specific securities or investments are for illustrative purposes only and are not intended as investment advice nor are they a recommendation to take any action. Individual securities mentioned may be held in client accounts. Past performance is no guarantee of future results.
As with all investments, there are associated inherent risks including loss of principal. Stock markets, especially foreign markets, are volatile and can decline significantly in response to adverse issuer, political, regulatory, market, or economic developments. Sector and factor investments concentrate in a particular industry or investment attribute, and the investments’ performance could depend heavily on the performance of that industry or attribute and be more volatile than the performance of less concentrated investment options and the market as a whole. Securities of companies with smaller market capitalizations tend to be more volatile and less liquid than larger company stocks. Foreign markets, particularly emerging markets, can be more volatile than U.S. markets due to increased political, regulatory, social or economic uncertainties. Fixed Income investments have exposure to credit, interest rate, market, and inflation risk. Diversification does not ensure a profit or guarantee against a loss.
The S&P 500 Information Technology Sector Index comprises the companies within the S&P 500 that are classified in the information technology sector under the Global Industry Classification Standard (GICS). The S&P 500 Index measures the performance of 500 large-capitalization U.S. companies. The BofA Global Fund Manager Survey is a monthly survey of professional investors by BofA Global Research on their asset allocation, positioning and views on markets and the economy. The Silicon Data LLM Token Expenditure Index measures the usage-weighted average price paid per million tokens processed by large language models. The Silicon Data B200 On-Demand Rental Index measures the hourly price to rent B200-class graphics processing units on demand from cloud providers other than the largest hyperscalers. Common Vulnerabilities and Exposures (CVE) is a public catalog of disclosed cybersecurity flaws, each published with its own identifier and recorded in the U.S. National Vulnerability Database (NVD). Earnings per share (EPS) growth measures the rate at which a company’s or group of companies’ earnings per share increase over a specified period of time and is often used as an indicator of profitability trends.
Please contact your AIM Regional Consultant for more information or to address any questions that you may have.
Algorithmic Investment Models LLC (AIM), 125 Newbury St. 4th Floor, Boston, MA 02116 (844-401-7699)