

The midterms’ blue wave crashed into the AI trade. Markets cheered the results on Wednesday, then made a sharp U-turn on Thursday. AI stocks fell the most and defensive stocks the least, but there were few places to make money. The move away from the biggest stocks has been building since October. Are tech stocks cheap now? It’s hard to see who is paying the bill for AI. More weird markets. A bad day for Binance.
1. The semiconductor and Nasdaq 100 ETFs had their worst day since March 2020:
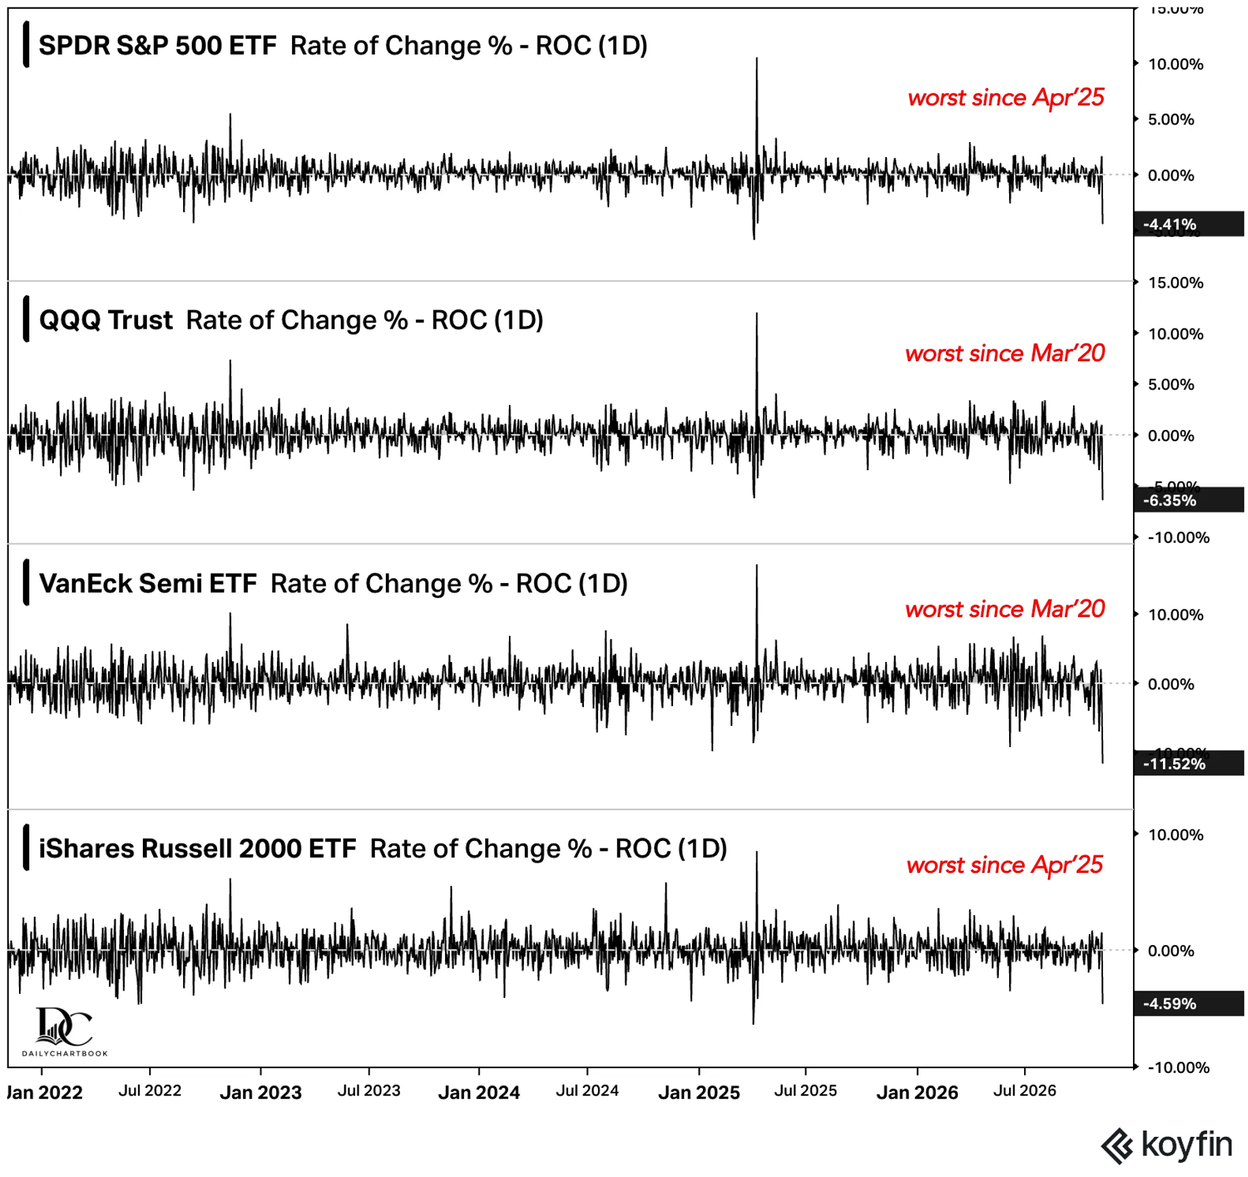 Source: Koyfin via the Daily Chartbook on 11/5/2026
2. The market’s recent winners were hit hard:
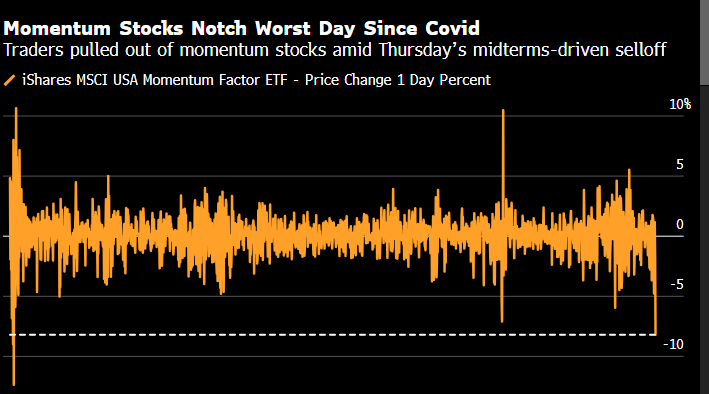 Source: @cfromhertz
3. Thursday accelerated a move that was already underway:
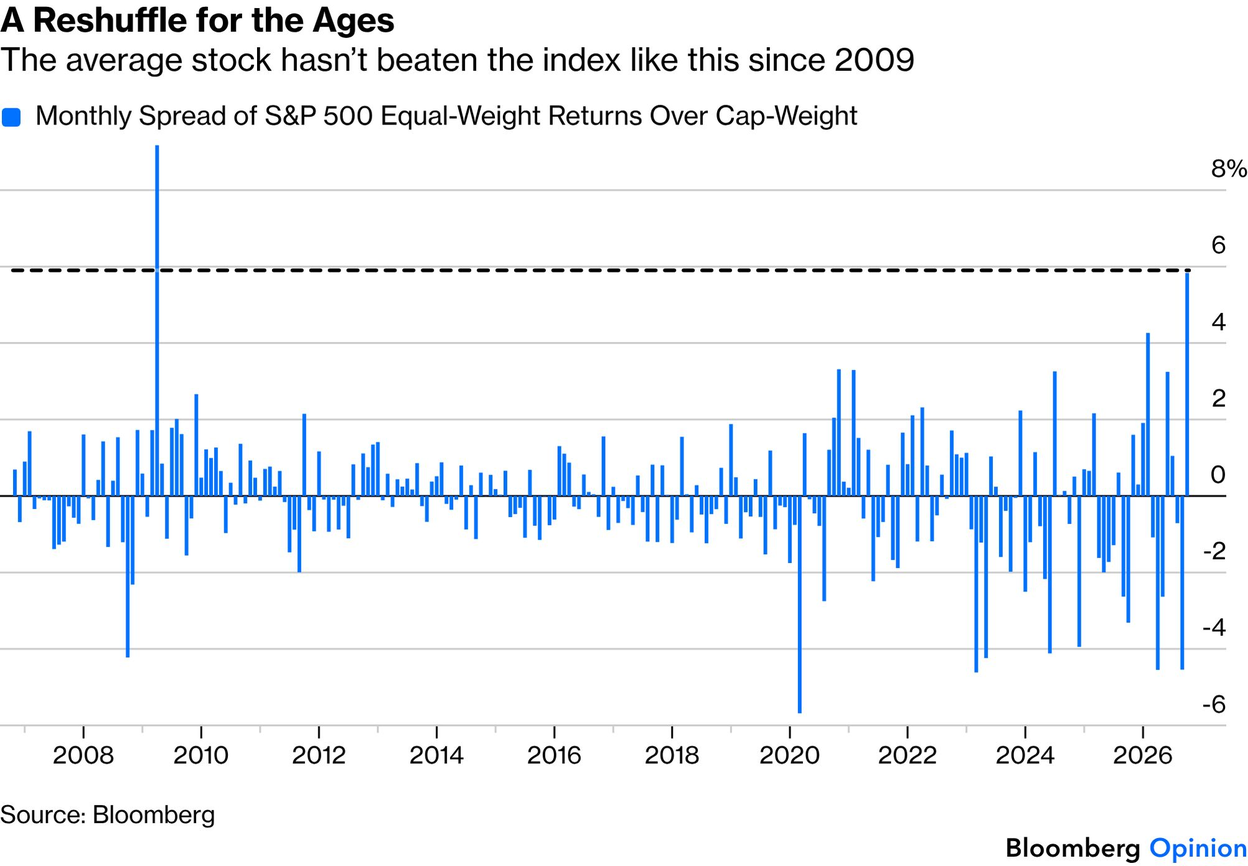 Source: John Authers, Points of Return on 11/2/2026
4. Texas has, by far, the largest data center pipeline:
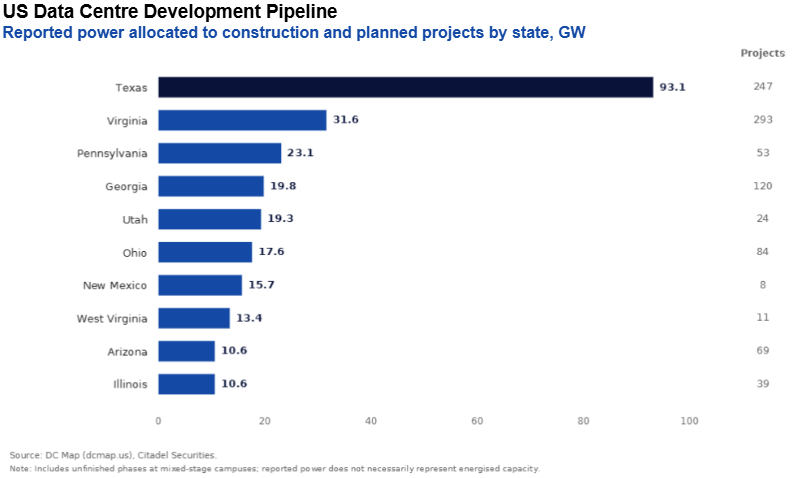 Source: Frank Flight, Citadel Securities
5. It also swung further toward Democrats than any other state:
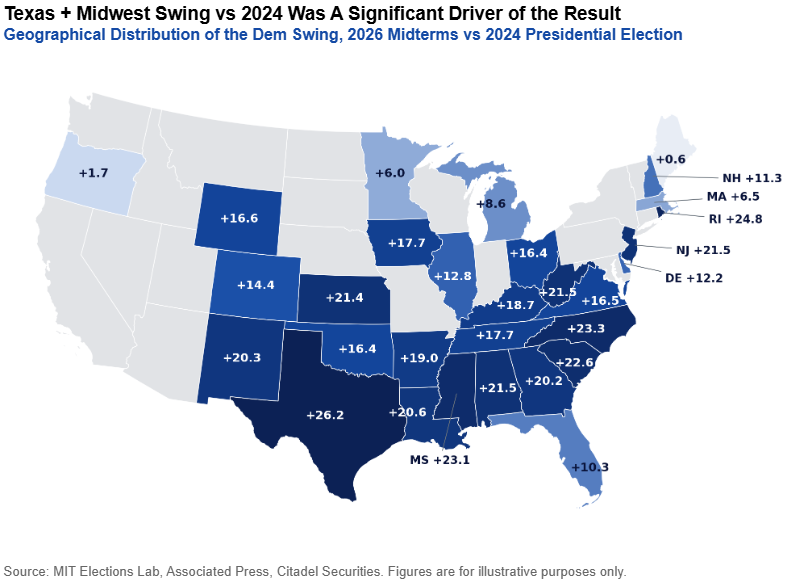 Source: Frank Flight, Citadel Securities
6. From the market’s perspective, data centers were on the ballot:
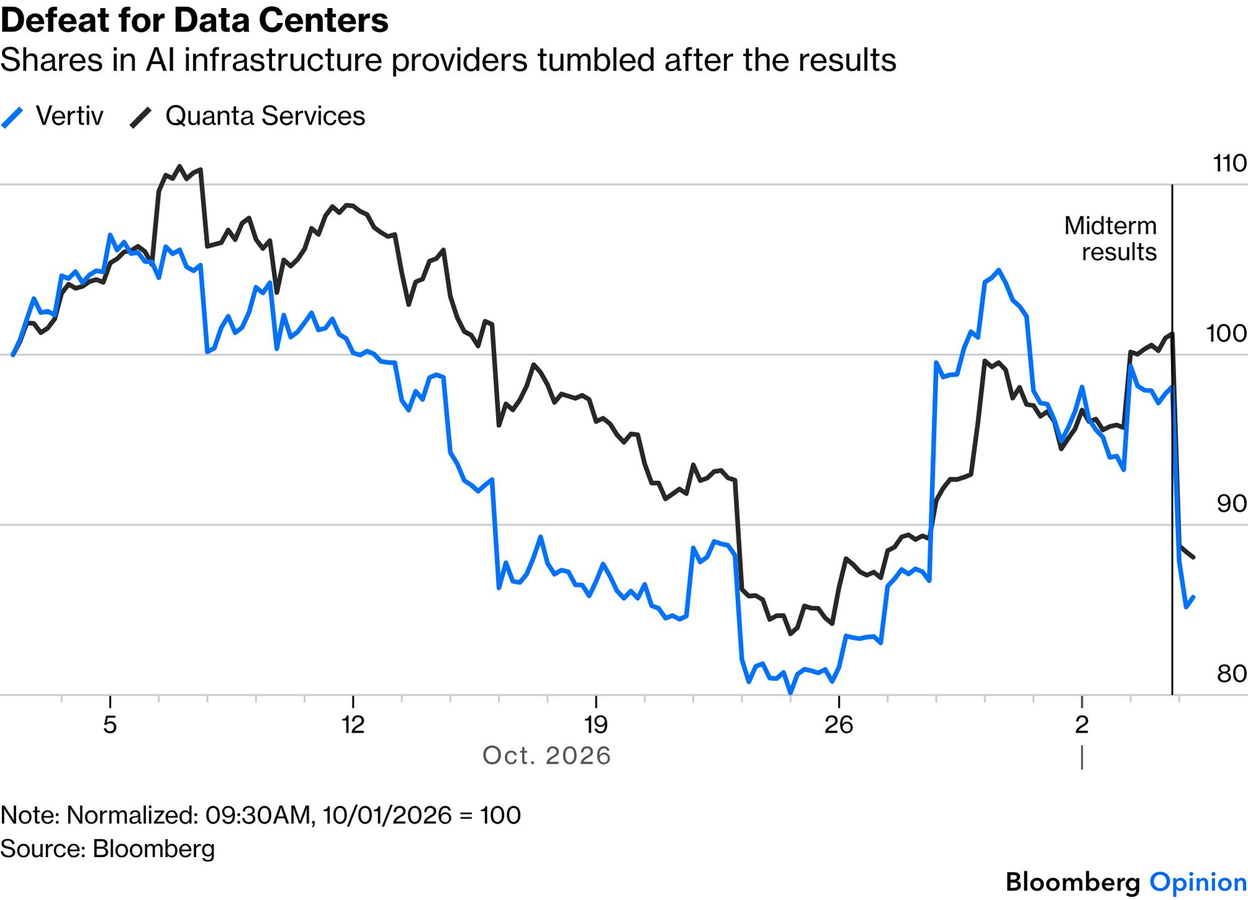 Source: John Authers, Points of Return on 11/5/2026
7. Parts of the AI trade are already in a bear market:
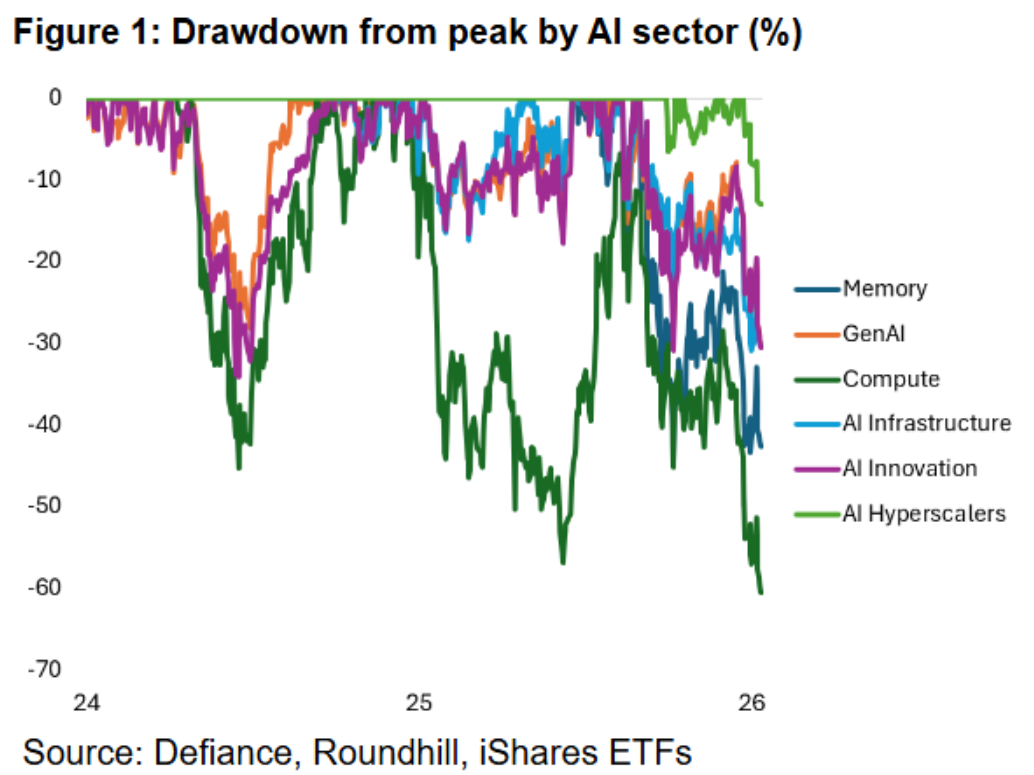 Source: Ben Emons, Highline Asset Management via Bloomberg Odd Lots
8. I believe tech earnings are temporarily inflated, but there’s still a price where the stocks are cheap:
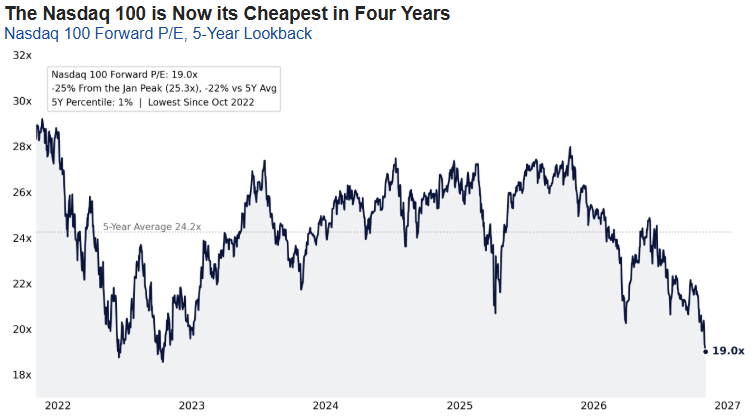 Source: Bloomberg, S&P Global, as compiled by Citadel Securities, Global Market Intelligence, as of November 3, 2026.
9. Today’s retail investors almost always want to buy the dip. Professionals are a bit more selective:
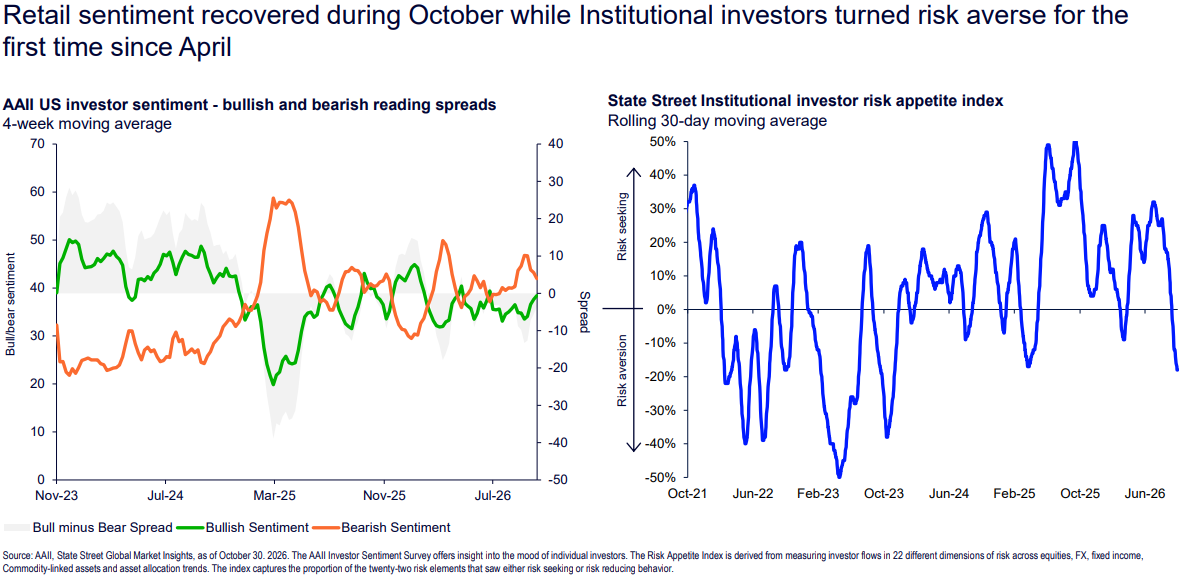 Source: State Street Investment Management Chart Pack, November 2026 edition
10. We’re spending more on tech, as a share of GDP, than at the peak of the dot-com boom:
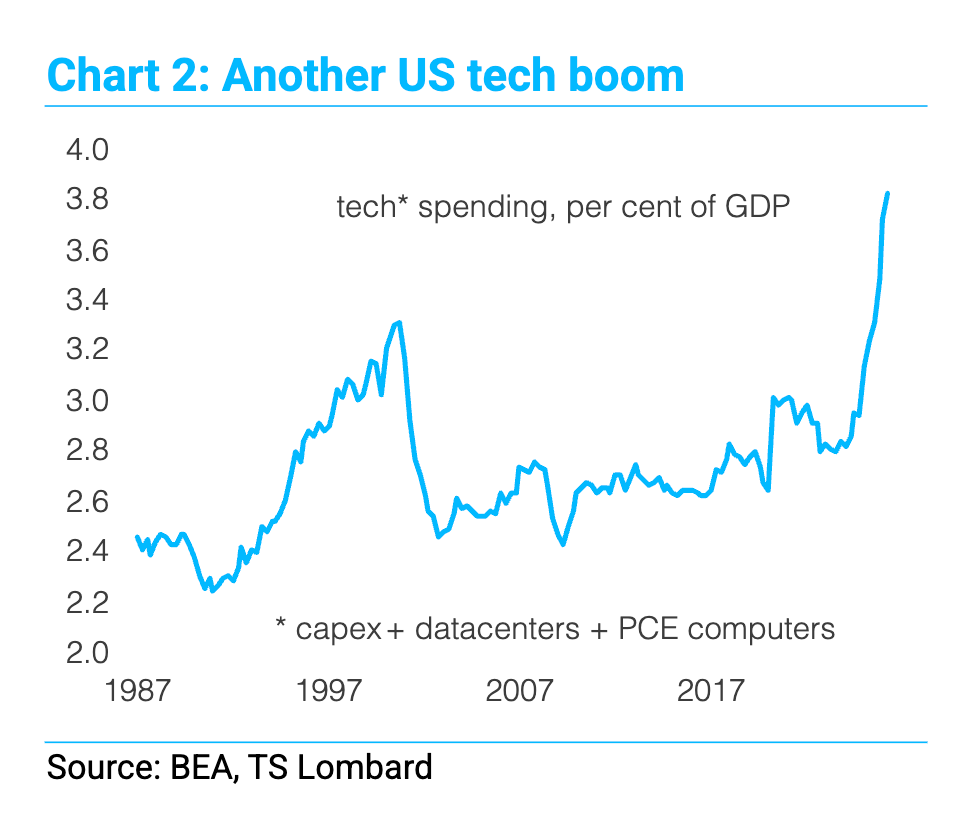 Source: Chartbook a newsletter from Adam Tooze on 11/3/2026
11. Balance sheets don’t show the full extent of AI companies’ financial commitments, but markets are clearly aware:
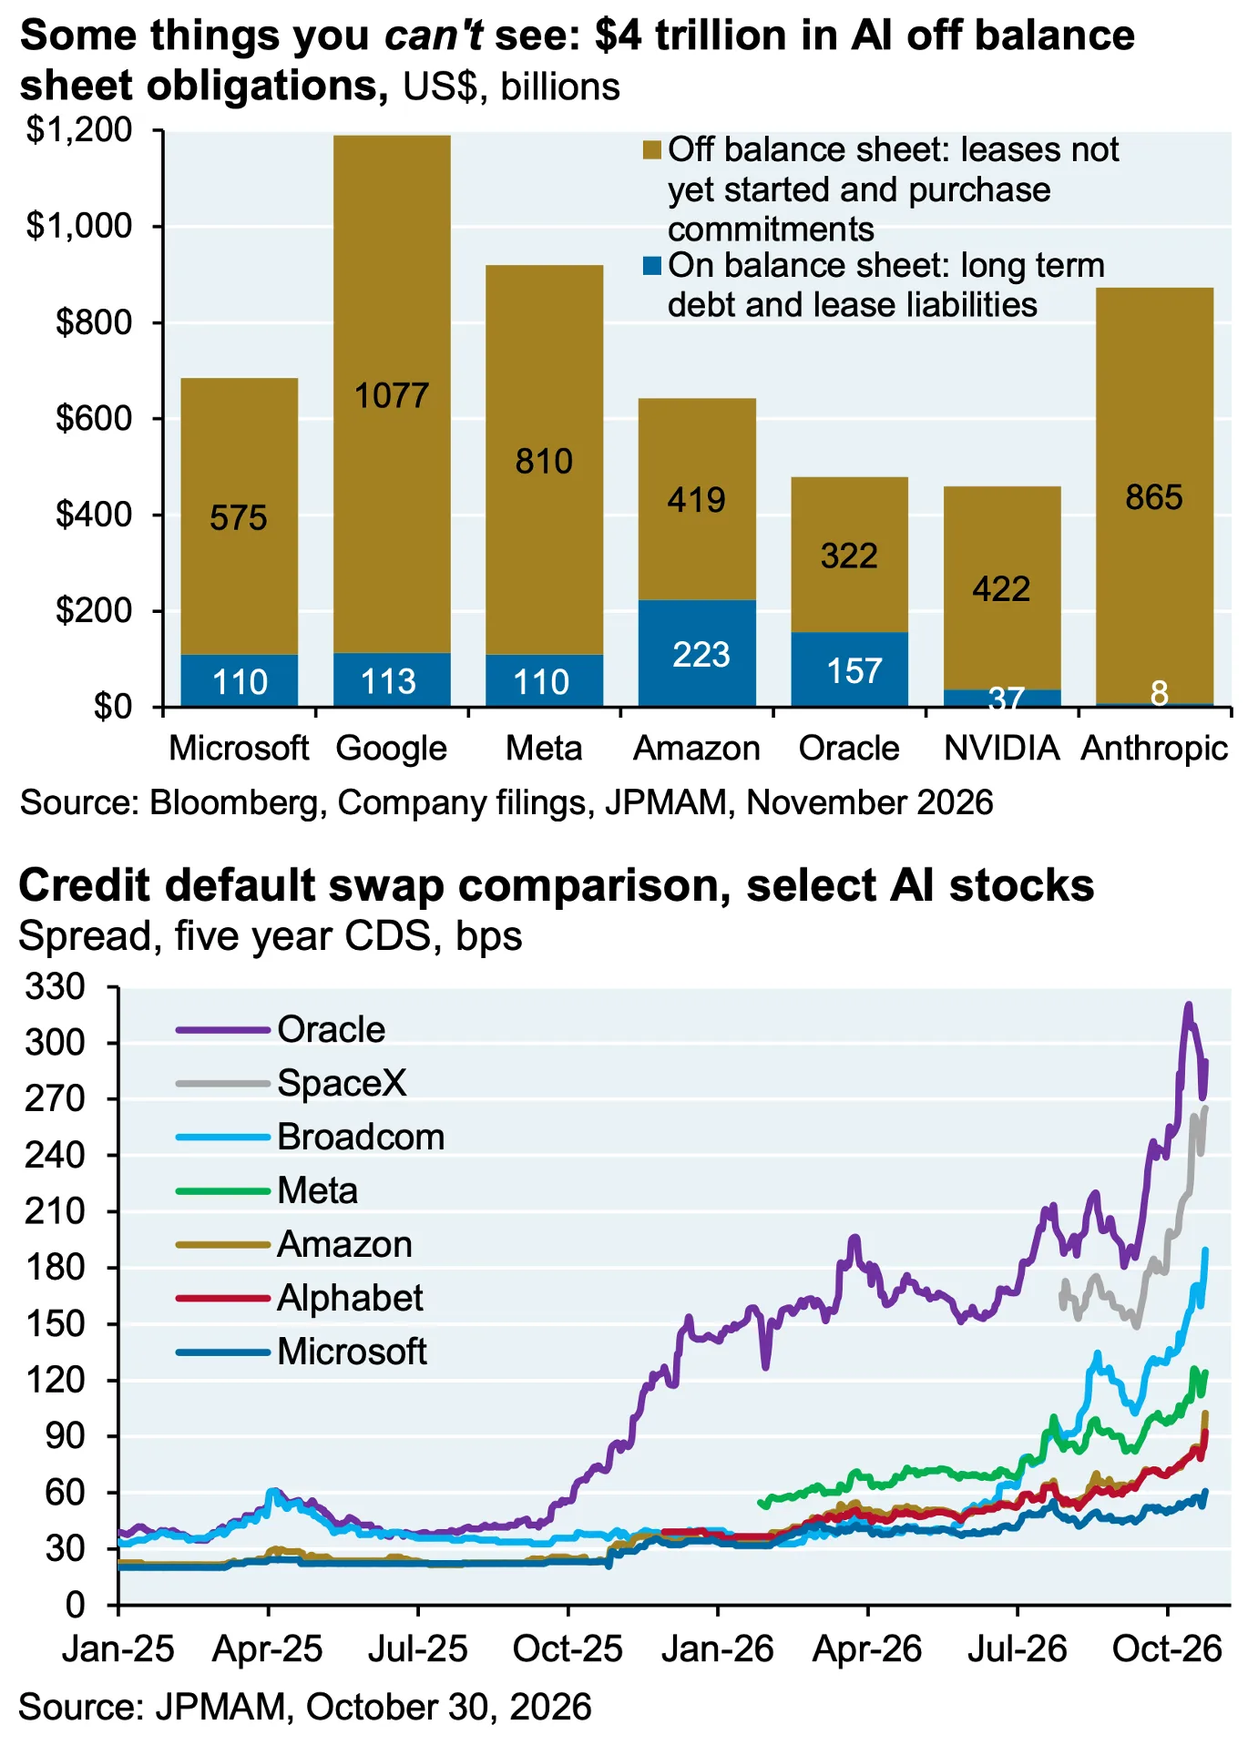 Source: Michael Cembalest, JPMorgan via the Daily Chartbook on 11/5/2026
12. This year’s two best sectors are negatively correlated, a first going back to 1973:
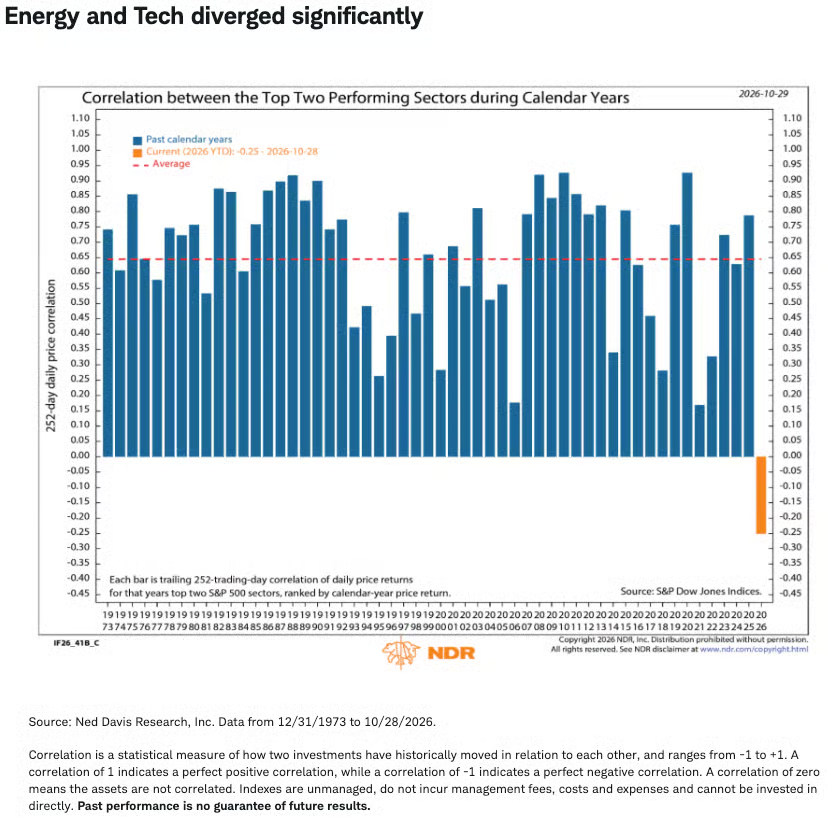 Source: NDR via Charles Schwab and the Daily Chartbook on 11/4/2026
13. A fake job interview and one engineer’s laptop opened the door to a $6.3 billion heist, per Bloomberg reporting:
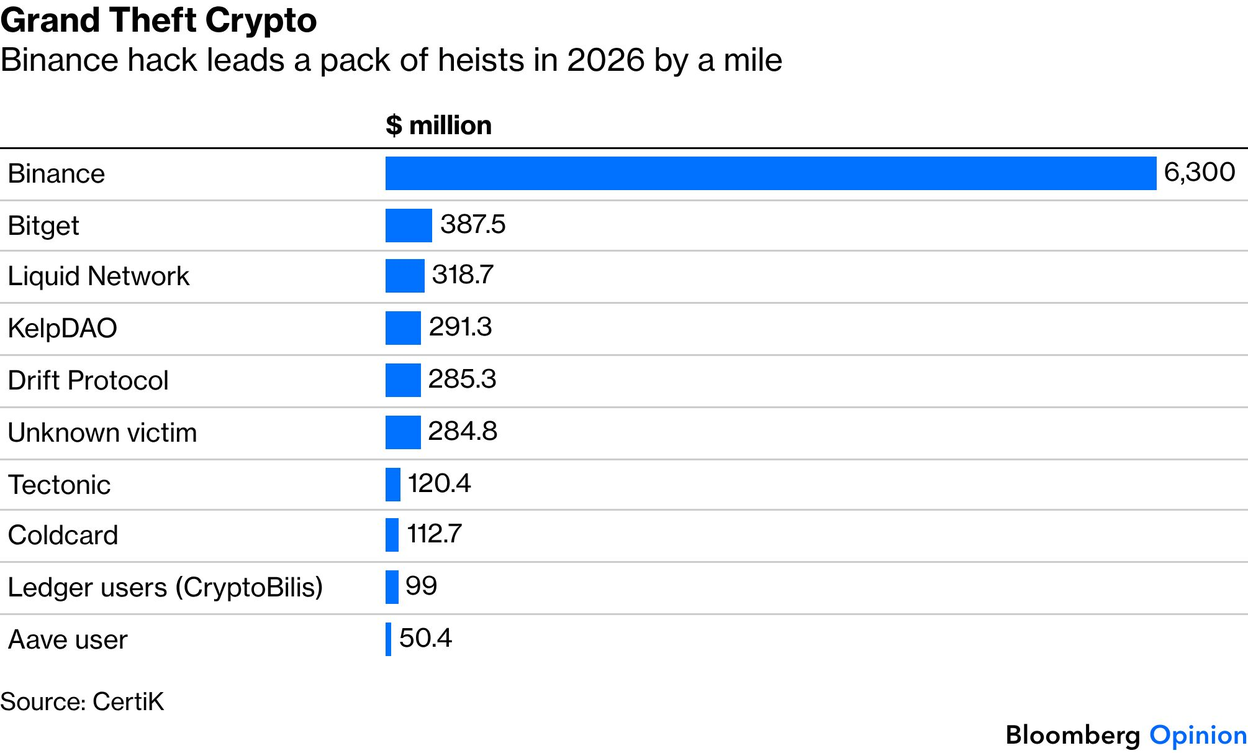 Source: John Authers, Points of Return on 11/3/2026
Disclosures:
Copyright © 2026 Algorithmic Investment Models LLC (AIM). All rights reserved. All materials appearing in this commentary are protected by copyright as a collective work or compilation under U.S. copyright laws and are the property of Algorithmic Investment Models. You may not copy, reproduce, publish, use, create derivative works, transmit, sell or in any way exploit any content, in whole or in part, in this commentary without express permission from Algorithmic Investment Models.
Certain information contained herein constitutes “forward-looking statements,” which can be identified by the use of forward-looking terminology such as “may,” “will,” “should,” “expect,” “anticipate,” “project,” “estimate,” “intend,” “continue,” or “believe,” or the negatives thereof or other variations thereon or comparable terminology. Due to various risks and uncertainties, actual events, results or actual performance may differ materially from those reflected or contemplated in such forward-looking statements. Nothing contained herein may be relied upon as a guarantee, promise, assurance or a representation as to the future.
This material is provided for informational purposes only and does not in any sense constitute a solicitation or offer for the purchase or sale of a specific security or other investment options, nor does it constitute investment advice for any person. The material may contain forward or backward-looking statements regarding intent, beliefs regarding current or past expectations. The views expressed are also subject to change based on market and other conditions. The information presented in this report is based on data obtained from third party sources. Although it is believed to be accurate, no representation or warranty is made as to its accuracy or completeness.
The charts and infographics contained in this blog are typically based on data obtained from third parties and are believed to be accurate. The commentary included is the opinion of the author and subject to change at any time. Any reference to specific securities or investments are for illustrative purposes only and are not intended as investment advice nor are they a recommendation to take any action. Individual securities mentioned may be held in client accounts. Past performance is no guarantee of future results.
As with all investments, there are associated inherent risks including loss of principal. Stock markets, especially foreign markets, are volatile and can decline significantly in response to adverse issuer, political, regulatory, market, or economic developments. Sector and factor investments concentrate in a particular industry or investment attribute, and the investments’ performance could depend heavily on the performance of that industry or attribute and be more volatile than the performance of less concentrated investment options and the market as a whole. Securities of companies with smaller market capitalizations tend to be more volatile and less liquid than larger company stocks. Foreign markets, particularly emerging markets, can be more volatile than U.S. markets due to increased political, regulatory, social or economic uncertainties. Fixed Income investments have exposure to credit, interest rate, market, and inflation risk. Diversification does not ensure a profit or guarantee against a loss.
The S&P 500 Equal Weight Index equally weights the constituents of the S&P 500 Index. The S&P 500 Index measures the performance of 500 large-capitalization U.S. companies. The AAII Investor Sentiment Survey measures the share of individual investors who are bullish, neutral or bearish on the stock market over the next six months, based on a weekly poll of American Association of Individual Investors members. The State Street Institutional Investor Risk Appetite Index measures whether institutional investors are adding or reducing risk, based on their flows across 22 dimensions of risk in equities, currencies, fixed income and commodity-linked assets. The Nasdaq-100 Index (NDX) is a modified market-capitalization-weighted index that includes 100 of the largest non-financial companies listed on the Nasdaq Stock Market. The MVIS US Listed Semiconductor 25 Index measures the performance of the 25 largest and most liquid U.S.-listed companies involved in semiconductor production and equipment. The Russell 2000 Index is a benchmark for U.S. small-cap stocks, measuring the performance of the 2,000 smallest companies in the broader Russell 3000 Index. The MSCI USA Momentum SR Variant Index measures the performance of U.S. large- and mid-cap stocks with high recent price momentum, selected from the MSCI USA Index. The price-to-earnings ratio compares a company’s or index’s share price with its earnings per share. A moving average is a statistical measure that smooths price data by calculating the average value over a specified period. Gross domestic product (GDP) is the total monetary value of all finished goods and services produced within a country’s borders during a specific period and is a broad measure of overall economic activity. A credit default swap (CDS) is a contract that compensates the buyer if a borrower defaults. Its spread, the annual cost of that protection, is a market measure of default risk.
Please contact your AIM Regional Consultant for more information or to address any questions that you may have.
Algorithmic Investment Models LLC (AIM), 125 Newbury St. 4th Floor, Boston, MA 02116 (844-401-7699)