

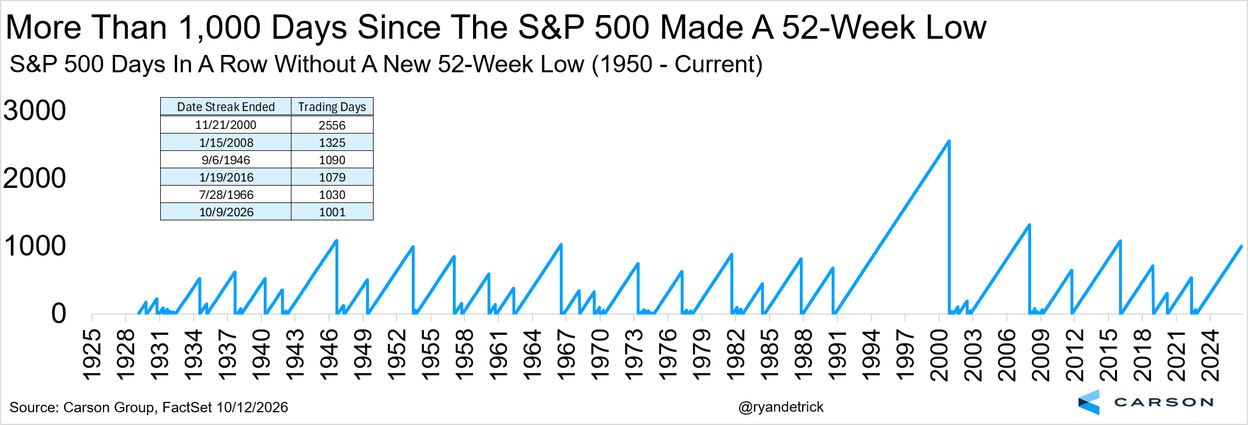
The S&P 500 hasn’t made a new 52-week low in over 1,000 trading days. Underneath, it’s a very different story. It’s been tough sledding for the average stock, but you’d never know it looking at the indices. Inflationary pressures are rising along with economic growth, and it’s getting harder and harder to make the case for lower rates. Investors don’t have to stretch for yield. Earnings season is about to pick up. What’s your mortgage rate?
1. The S&P 500 is on one of its longest streaks without a new 52-week low since 1950:
 Source: @RyanDetrick
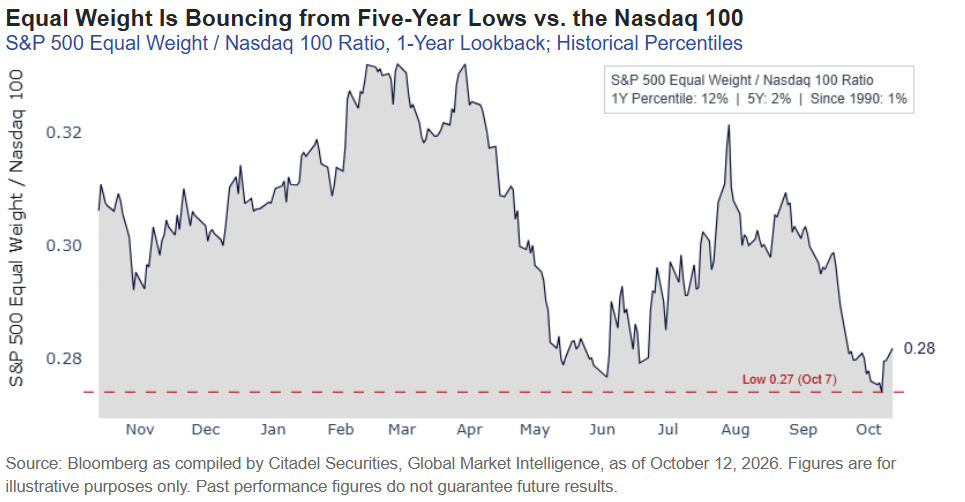
2. Under the surface, the average stock is near its weakest level against the Nasdaq 100 since 1990:
 Source: Scott Rubner, Citadel Global Market Intelligence
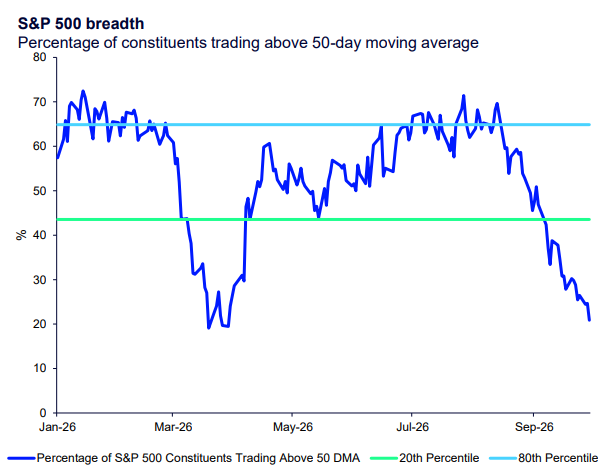
3. Only about one in five S&P 500 stocks is trading above its 50-day moving average:
 Source: State Street Investment Management Chart Pack, Bloomberg Finance L.P., as of September 30, 2026
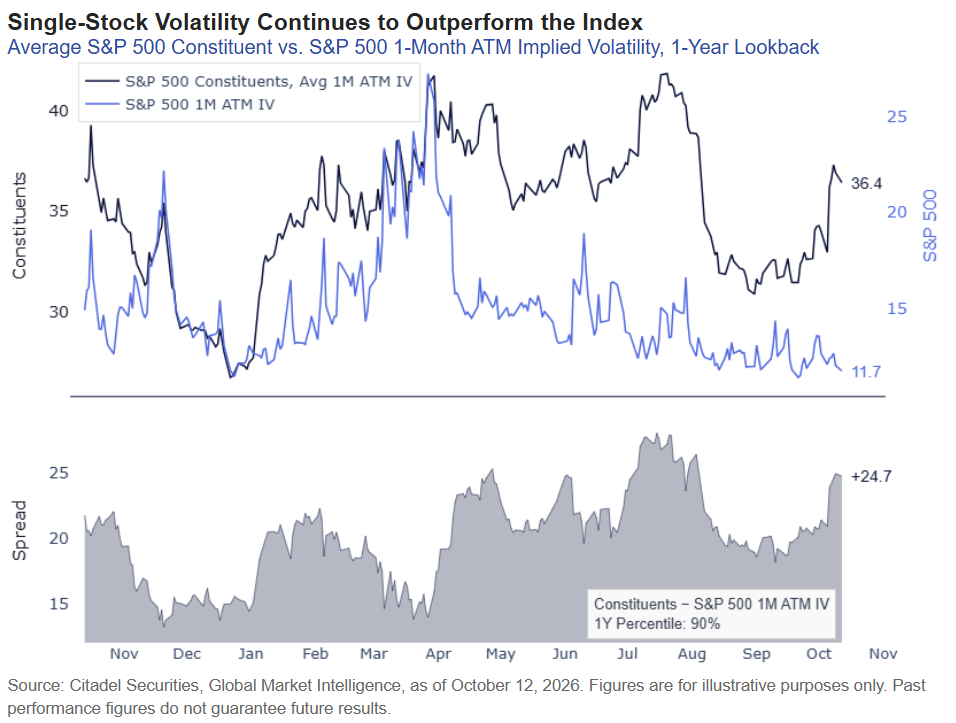
4. Single stocks are moving a lot more than the index:
 Source: Scott Rubner, Citadel Global Market Intelligence
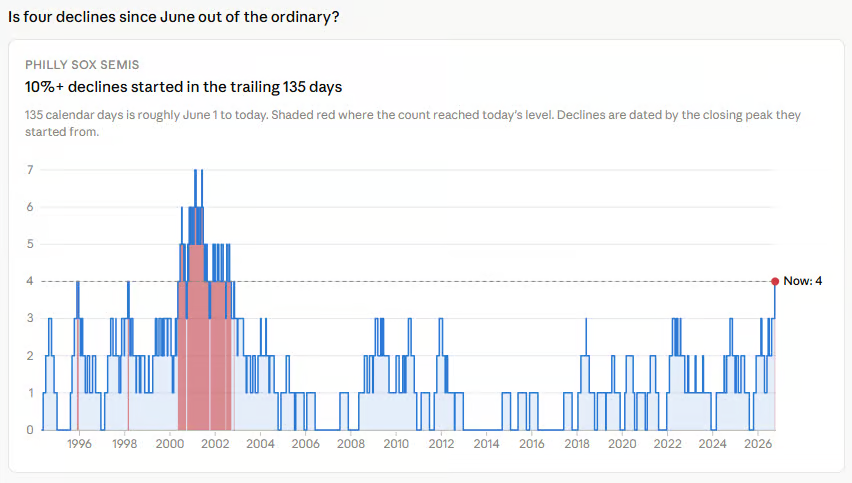
5. Surprisingly, the indices have held up despite four 10% declines in semiconductors since June:
 Source: @bespokeinvest via the Daily Chartbook on 10/14/2026
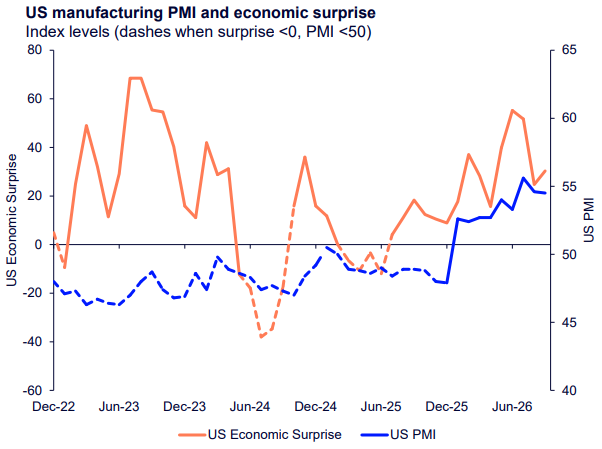
6. Economic growth is accelerating, with manufacturing back in expansion and economic data beating expectations:
 Source: State Street Investment Management Chart Pack, Bloomberg Finance L.P., as of September 30, 2026
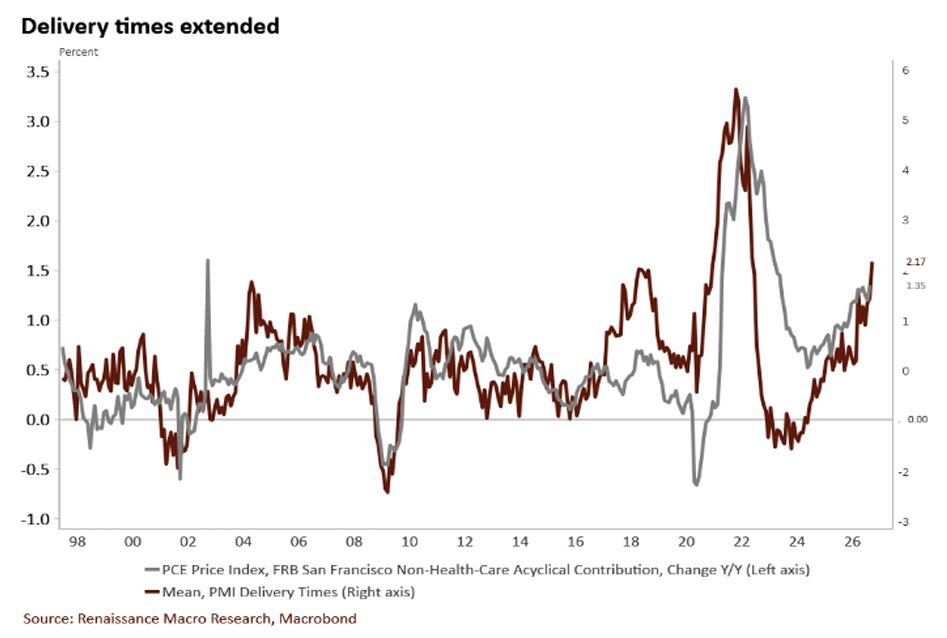
7. Pressure is growing on supply chains again. It’s difficult to grow the economy and stamp out inflation at the same time:
 Source: Renaissance Macro via Bloomberg Odd Lots
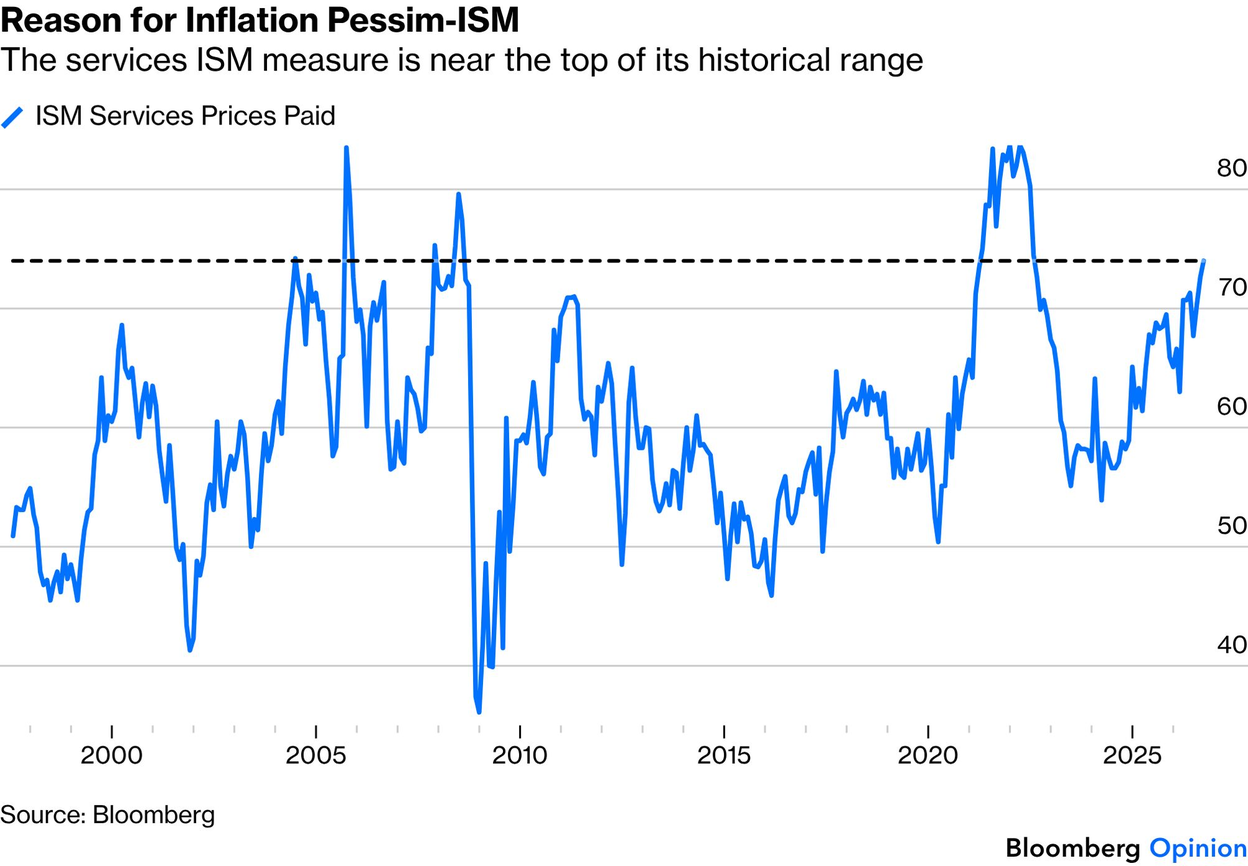
8. ISM Services Prices Paid is near the top of its historical range:
 Source: John Authers, Points of Return on 10/6/2026
9. At current rates, investors seem to find short-term government bonds quite attractive:
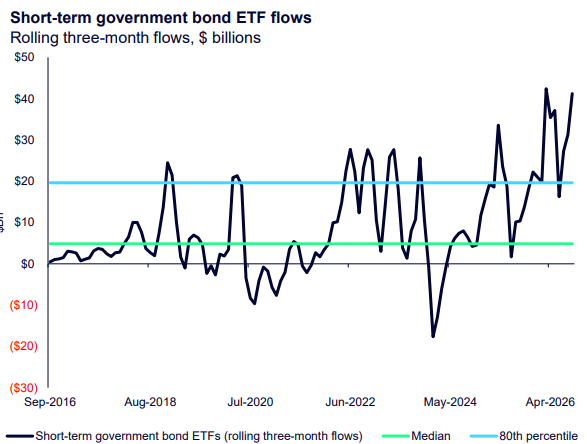 Source: State Street Investment Management Chart Pack, Bloomberg Finance L.P., based on State Street Investment Management calculations, as of September 30, 2026
10. Earnings season is here:
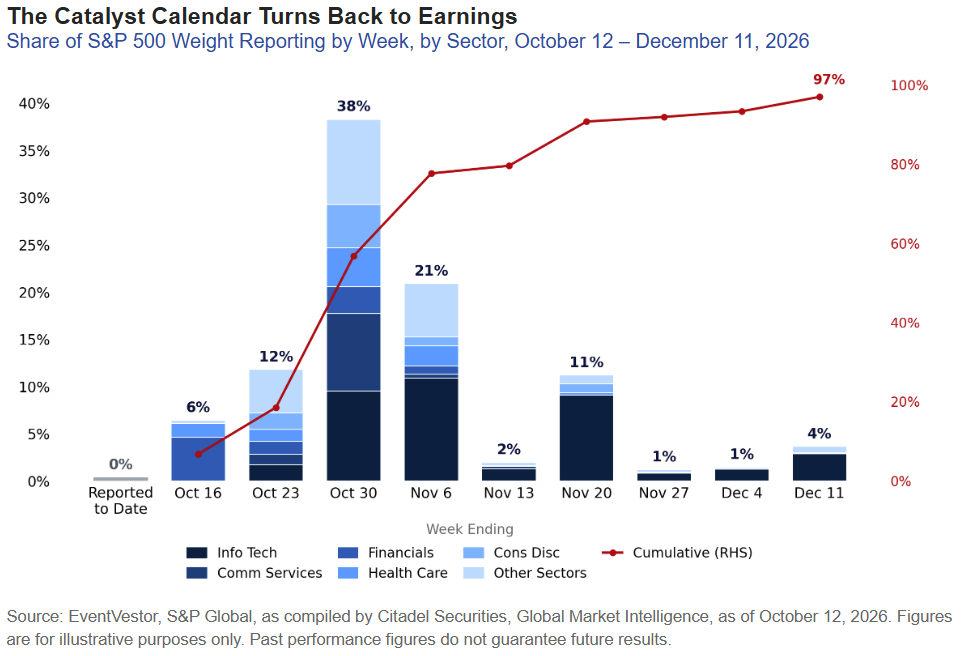 Source: Scott Rubner, Citadel Global Market Intelligence
11. The golden handcuffs are slowly coming off:
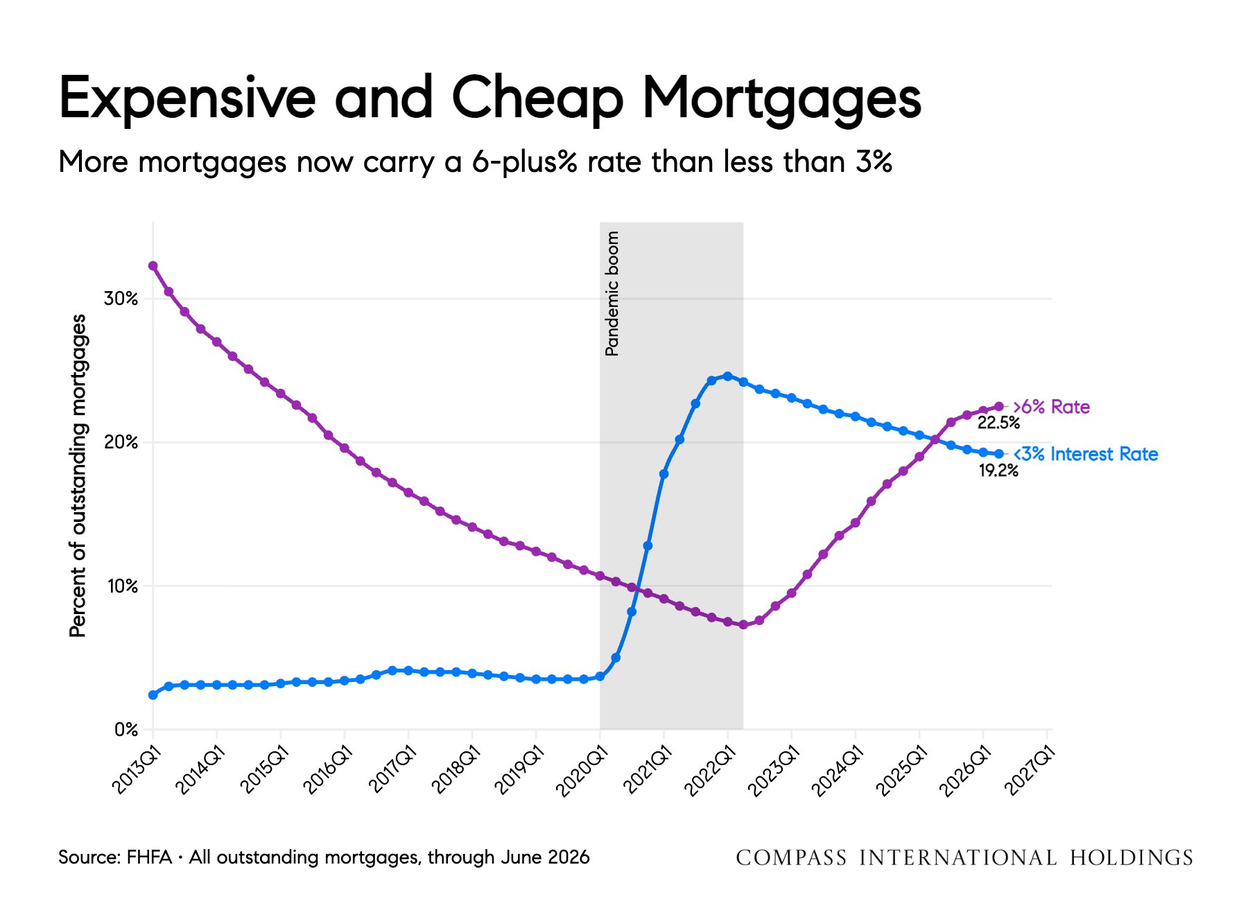 Source: @mikesimonsen
Disclosures:
Copyright © 2026 Algorithmic Investment Models LLC (AIM). All rights reserved. All materials appearing in this commentary are protected by copyright as a collective work or compilation under U.S. copyright laws and are the property of Algorithmic Investment Models. You may not copy, reproduce, publish, use, create derivative works, transmit, sell or in any way exploit any content, in whole or in part, in this commentary without express permission from Algorithmic Investment Models.
Certain information contained herein constitutes “forward-looking statements,” which can be identified by the use of forward-looking terminology such as “may,” “will,” “should,” “expect,” “anticipate,” “project,” “estimate,” “intend,” “continue,” or “believe,” or the negatives thereof or other variations thereon or comparable terminology. Due to various risks and uncertainties, actual events, results or actual performance may differ materially from those reflected or contemplated in such forward-looking statements. Nothing contained herein may be relied upon as a guarantee, promise, assurance or a representation as to the future.
This material is provided for informational purposes only and does not in any sense constitute a solicitation or offer for the purchase or sale of a specific security or other investment options, nor does it constitute investment advice for any person. The material may contain forward or backward-looking statements regarding intent, beliefs regarding current or past expectations. The views expressed are also subject to change based on market and other conditions. The information presented in this report is based on data obtained from third party sources. Although it is believed to be accurate, no representation or warranty is made as to its accuracy or completeness.
The charts and infographics contained in this blog are typically based on data obtained from third parties and are believed to be accurate. The commentary included is the opinion of the author and subject to change at any time. Any reference to specific securities or investments are for illustrative purposes only and are not intended as investment advice nor are they a recommendation to take any action. Individual securities mentioned may be held in client accounts. Past performance is no guarantee of future results.
As with all investments, there are associated inherent risks including loss of principal. Stock markets, especially foreign markets, are volatile and can decline significantly in response to adverse issuer, political, regulatory, market, or economic developments. Sector and factor investments concentrate in a particular industry or investment attribute, and the investments’ performance could depend heavily on the performance of that industry or attribute and be more volatile than the performance of less concentrated investment options and the market as a whole. Securities of companies with smaller market capitalizations tend to be more volatile and less liquid than larger company stocks. Foreign markets, particularly emerging markets, can be more volatile than U.S. markets due to increased political, regulatory, social or economic uncertainties. Fixed Income investments have exposure to credit, interest rate, market, and inflation risk. Diversification does not ensure a profit or guarantee against a loss.
The S&P 500 Index measures the performance of 500 large-capitalization U.S. companies. The S&P 500 Equal Weight Index equally weights the constituents of the S&P 500 Index. The Nasdaq-100 Index (NDX) is a modified market-capitalization-weighted index that includes 100 of the largest non-financial companies listed on the Nasdaq Stock Market. One-month at-the-money implied volatility is the market’s expected volatility over the next month, derived from the prices of options with strike prices near the current price. The PHLX Semiconductor Index (SOX) measures the performance of U.S.-listed companies engaged in the design, distribution, manufacture and sale of semiconductors. The Citi Economic Surprise Index measures how much U.S. economic data releases have come in above or below consensus expectations. Positive readings mean the data has been better than expected. The ISM Manufacturing Index is a monthly survey-based indicator of U.S. manufacturing activity published by the Institute for Supply Management. The Federal Reserve Bank of San Francisco’s acyclical PCE inflation measures the contribution to PCE inflation from categories whose prices do not move closely with the business cycle. The non-health-care version excludes health care. PMI delivery times measure how long suppliers are taking to fill orders, as reported by purchasing managers in Purchasing Managers’ Index surveys. Higher readings indicate slower deliveries. The ISM Services Prices Paid Index, published monthly by the Institute for Supply Management, measures the share of services-sector purchasing managers reporting higher prices for the goods and services they buy; readings above 50 indicate rising prices. A moving average is a statistical measure that smooths price data by calculating the average value over a specified period. Inflation is the rate at which the general level of prices for goods and services rises over time, resulting in a decline in purchasing power.
Please contact your AIM Regional Consultant for more information or to address any questions that you may have.
Algorithmic Investment Models LLC (AIM), 125 Newbury St. 4th Floor, Boston, MA 02116 (844-401-7699)