By one measure, this is the best stock pickers market in over a decade. Market breadth has increased dramatically, both domestically and internationally. There’s even strong rotation within the technology sector itself. Market participants are beginning to push back on AI capex. Despite global economic momentum, the investment surge remains confined to technology, perhaps most concerningly in the U.S. Are the inmates running the asylum?
1. Relative calm at the index level has hidden major dispersion below the surface of global markets:
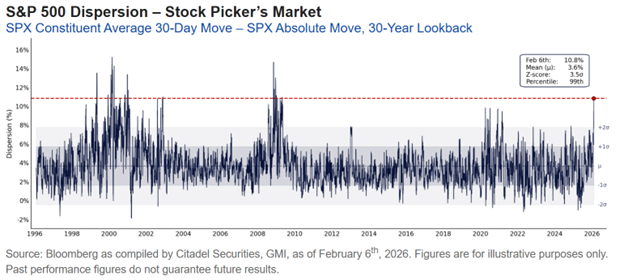 Source: Citadel Securities
2. The average S&P 500 stock is off to a strong start this year:
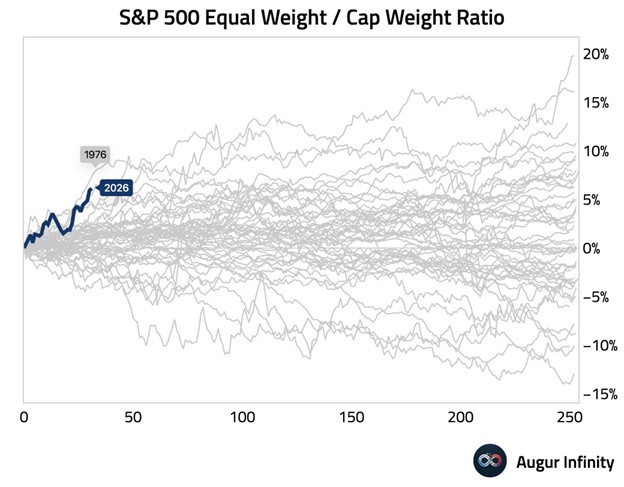 Source: @AugurInfinity
3. International equities have had their best start to the year, relative to U.S. equities, in at least 30 years:
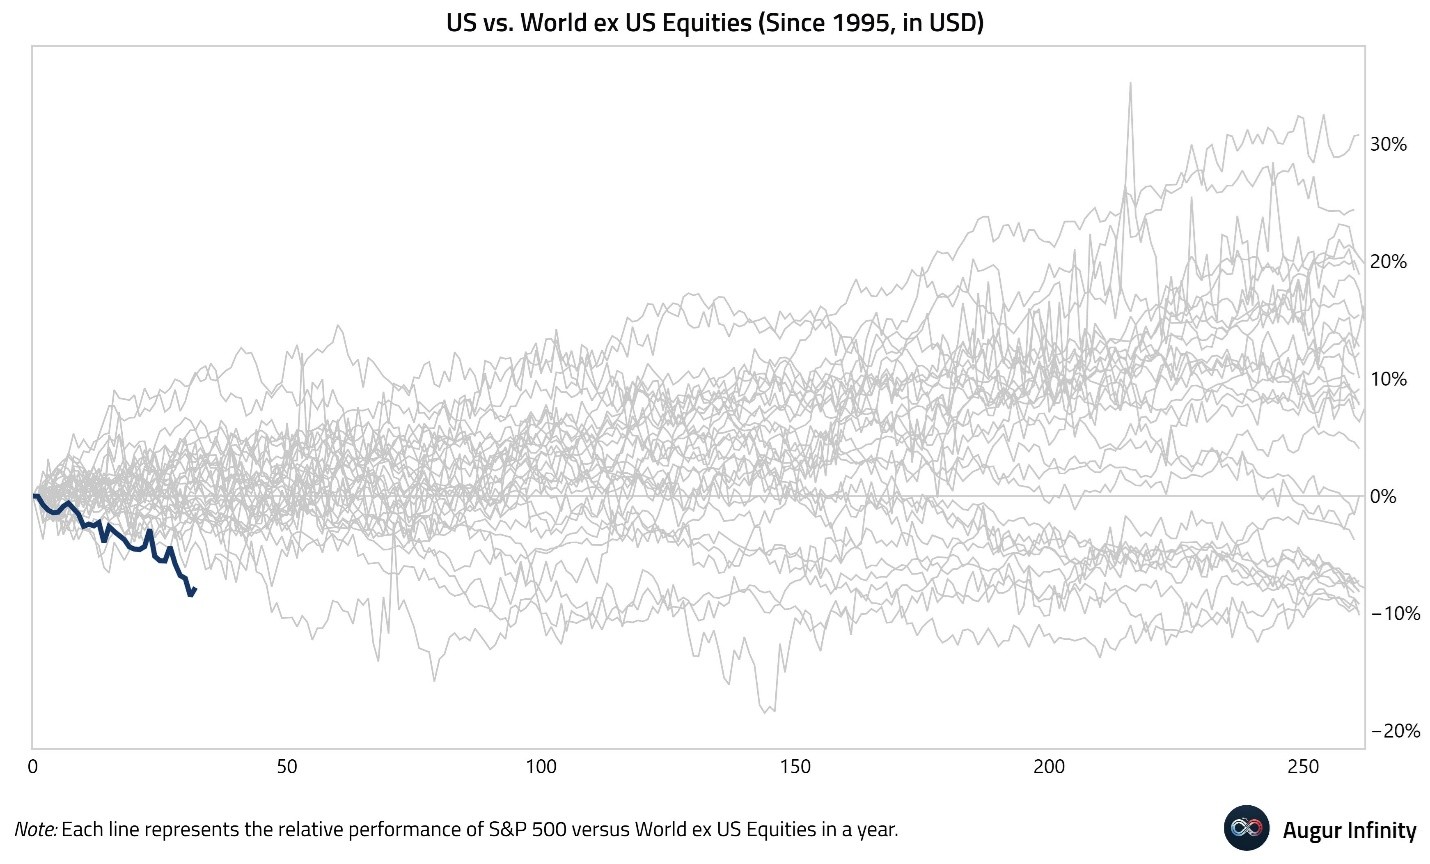 Source: @MikeZaccardi
4. The spoils of AI have not accrued evenly within the technology sector:
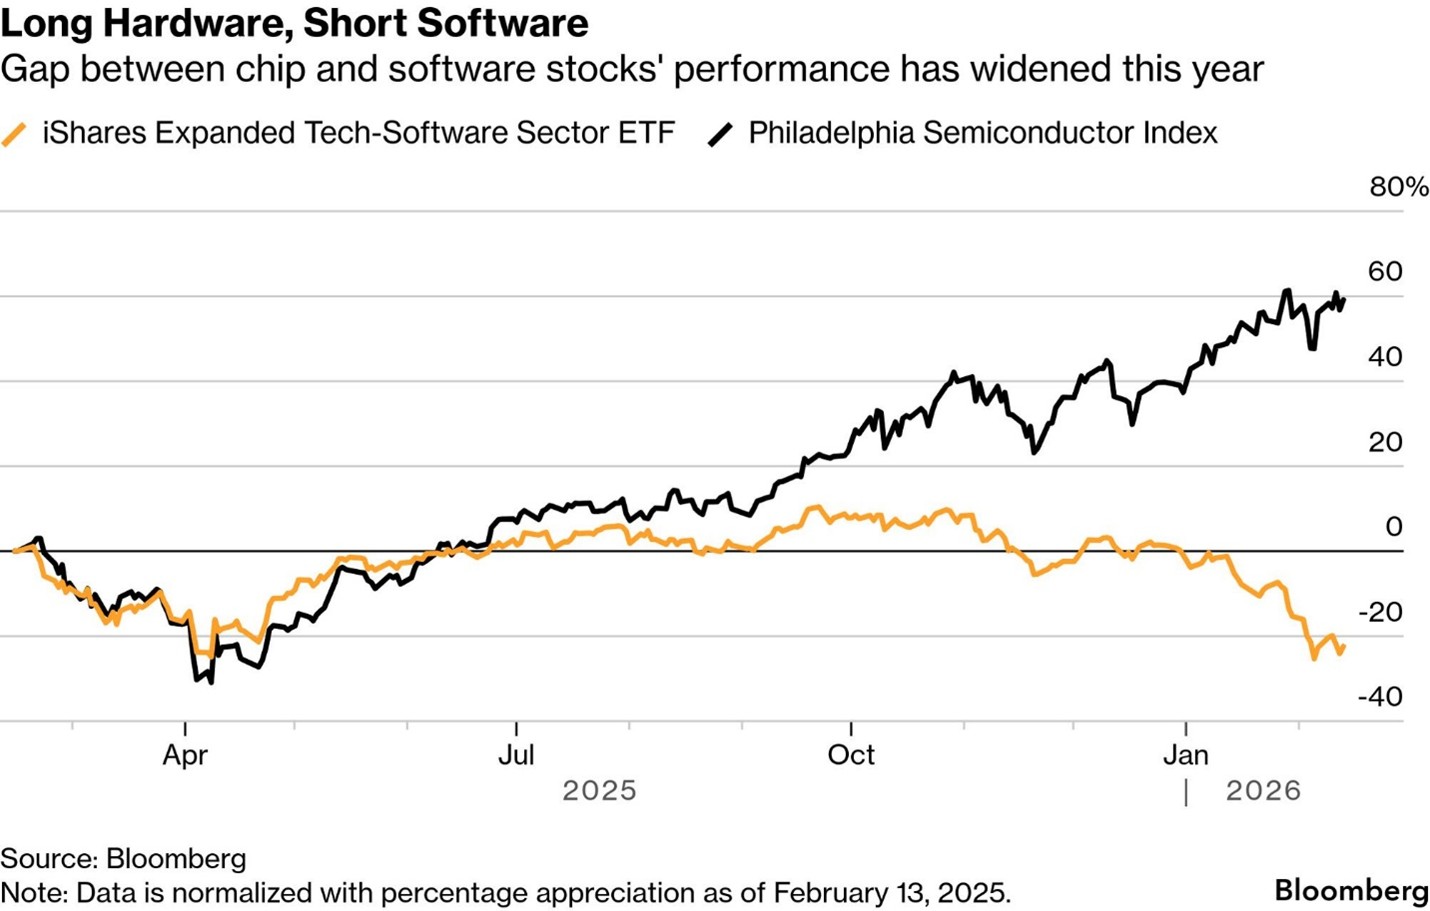 Source: Bloomberg Markets Daily
5. The rotation looks even more dramatic when taking a long-term view:
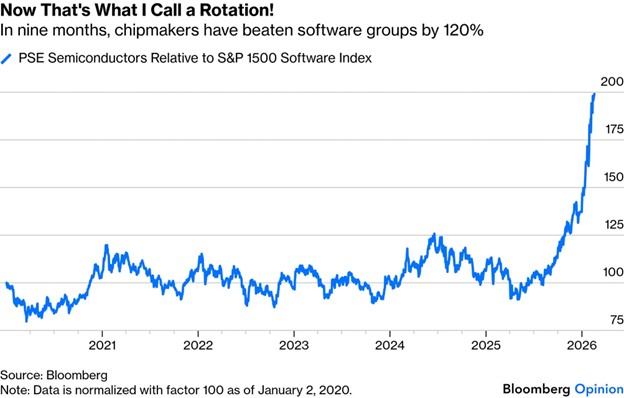 Source: John Authers, Points of Return
6. Investors are well aware that “gold rush” dynamics, like we’re seeing with the AI boom, have historically led to overinvestment:
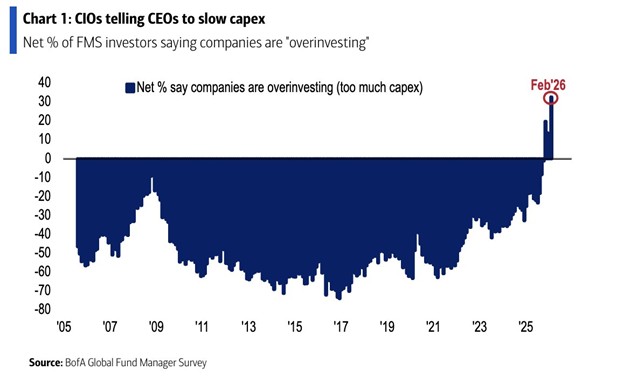 Source: @SamRo
7. The investment binge is transforming the near-term financial profile of the hyperscalers:
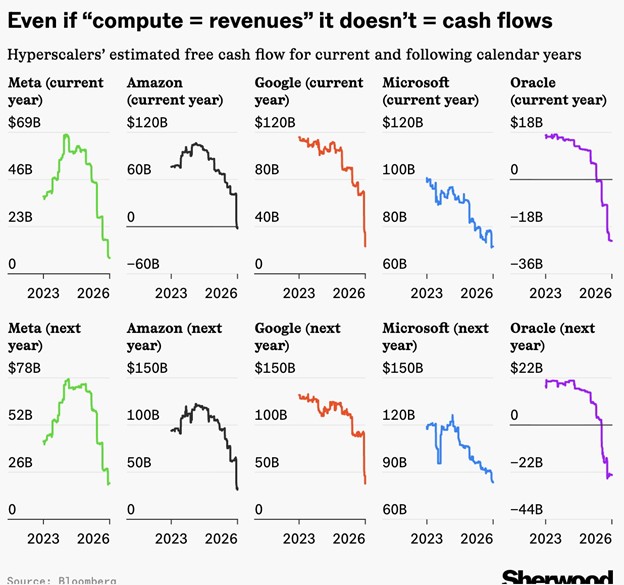 Source: Sherwood, @LJKawa via @ranimolla
8. Improving breadth in global equity markets has coincided with a broadening in economic momentum:
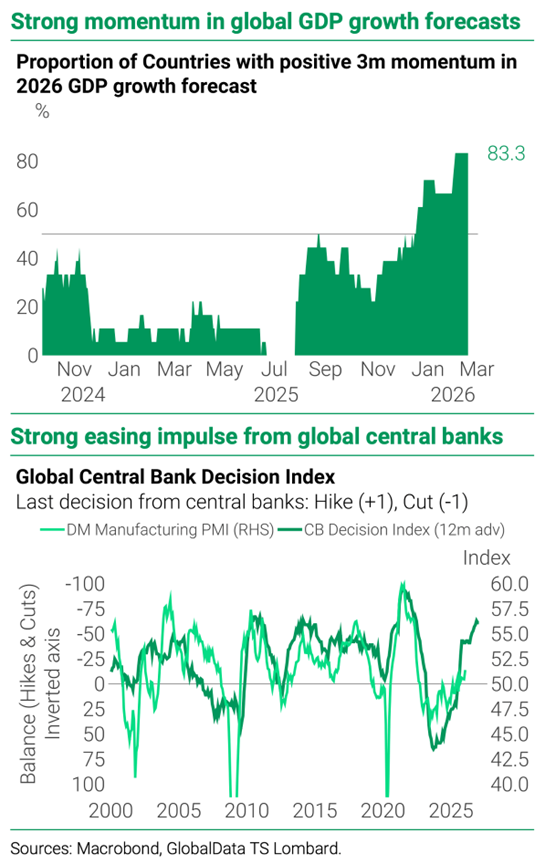 Source: Daniel von Ahlen, TS Lombard via the Daily Chartbook on 2/18/2026
9. But we’re still waiting to see a broadening of corporate investment:
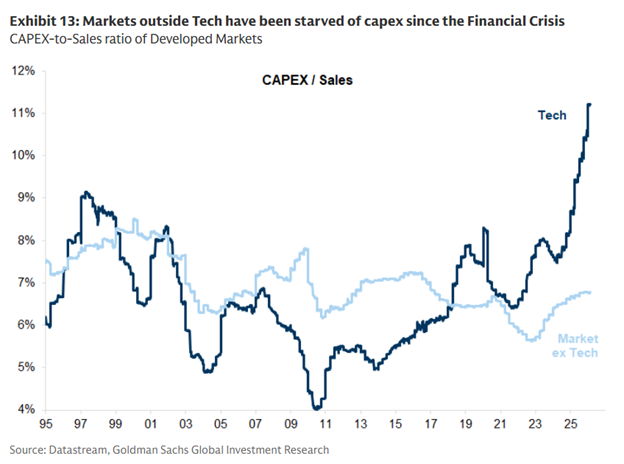 Source: @WTCM3
10. Cyclical components of U.S. GDP have weakened at an alarming rate:
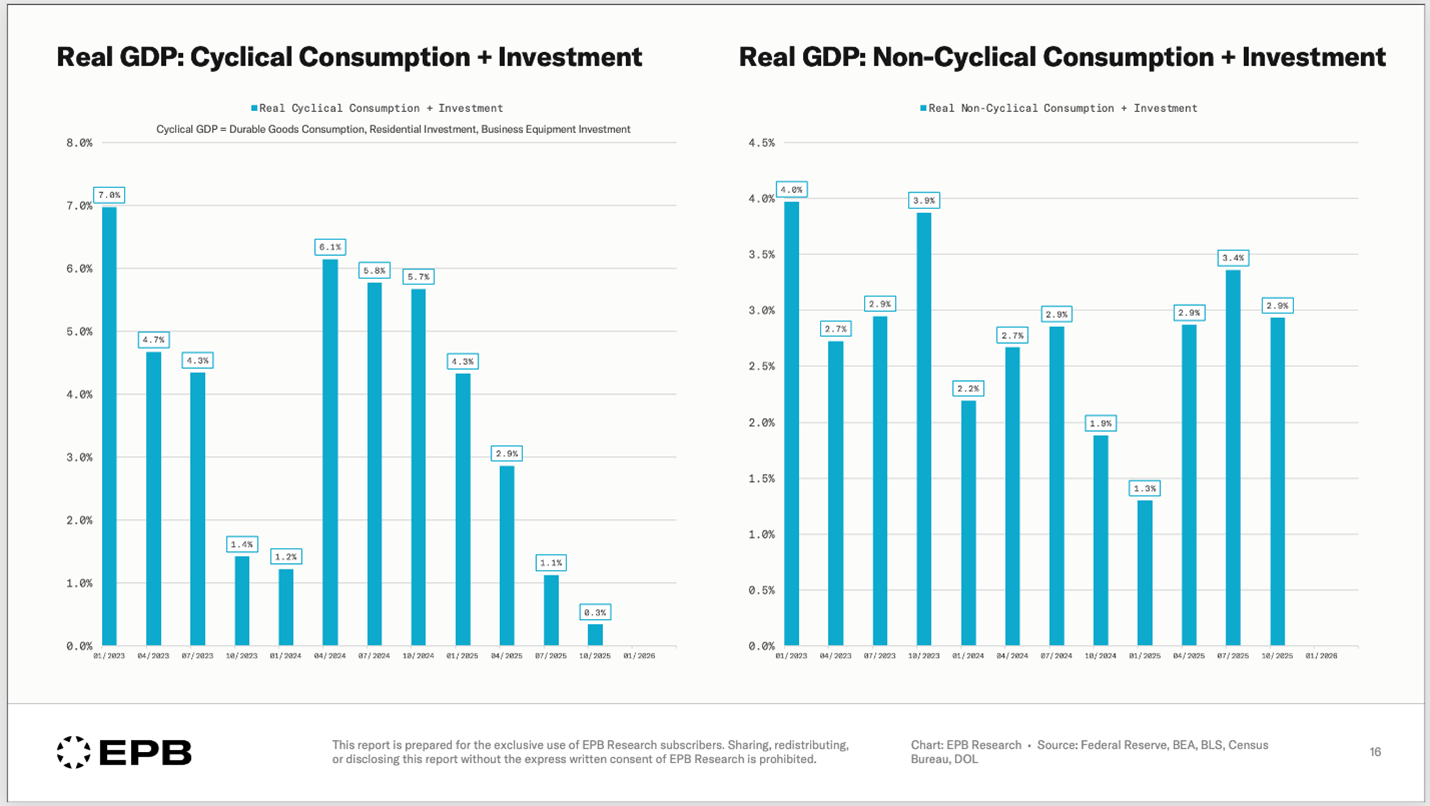 Source: @EPBResearch
11. How much influence do kids have over your spending decisions:
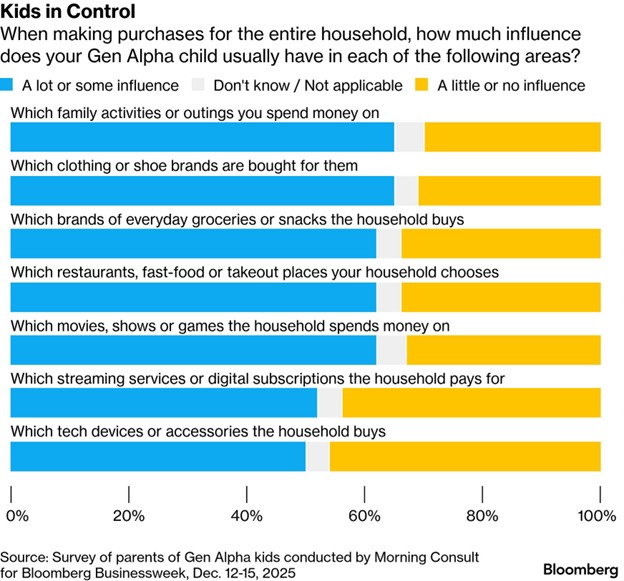 Source: Bloomberg Morning Briefing
Disclosures:
Copyright © 2026 Algorithmic Investment Models LLC (AIM). All rights reserved. All materials appearing in this commentary are protected by copyright as a collective work or compilation under U.S. copyright laws and are the property of Algorithmic Investment Models. You may not copy, reproduce, publish, use, create derivative works, transmit, sell or in any way exploit any content, in whole or in part, in this commentary without express permission from Algorithmic Investment Models.
Certain information contained herein constitutes “forward-looking statements,” which can be identified by the use of forward-looking terminology such as “may,” “will,” “should,” “expect,” “anticipate,” “project,” “estimate,” “intend,” “continue,” or “believe,” or the negatives thereof or other variations thereon or comparable terminology. Due to various risks and uncertainties, actual events, results or actual performance may differ materially from those reflected or contemplated in such forward-looking statements. Nothing contained herein may be relied upon as a guarantee, promise, assurance or a representation as to the future.
This material is provided for informational purposes only and does not in any sense constitute a solicitation or offer for the purchase or sale of a specific security or other investment options, nor does it constitute investment advice for any person. The material may contain forward or backward-looking statements regarding intent, beliefs regarding current or past expectations. The views expressed are also subject to change based on market and other conditions. The information presented in this report is based on data obtained from third party sources. Although it is believed to be accurate, no representation or warranty is made as to its accuracy or completeness.
The charts and infographics contained in this blog are typically based on data obtained from third parties and are believed to be accurate. The commentary included is the opinion of the author and subject to change at any time. Any reference to specific securities or investments are for illustrative purposes only and are not intended as investment advice nor are they a recommendation to take any action. Individual securities mentioned may be held in client accounts. Past performance is no guarantee of future results.
As with all investments, there are associated inherent risks including loss of principal. Stock markets, especially foreign markets, are volatile and can decline significantly in response to adverse issuer, political, regulatory, market, or economic developments. Sector and factor investments concentrate in a particular industry or investment attribute, and the investments’ performance could depend heavily on the performance of that industry or attribute and be more volatile than the performance of less concentrated investment options and the market as a whole. Securities of companies with smaller market capitalizations tend to be more volatile and less liquid than larger company stocks. Foreign markets, particularly emerging markets, can be more volatile than U.S. markets due to increased political, regulatory, social or economic uncertainties. Fixed Income investments have exposure to credit, interest rate, market, and inflation risk. Diversification does not ensure a profit or guarantee against a loss.
The ISM Manufacturing Index is a monthly survey-based indicator of U.S. manufacturing activity published by the Institute for Supply Management. The BofA Truckload Diffusion Indicator measures the breadth of strength across U.S. trucking volumes based on Bank of America card and logistics data. The MSCI World Value Index tracks large- and mid-cap developed market equities exhibiting value characteristics. The MSCI World Momentum Index tracks developed market equities demonstrating persistent price strength and momentum characteristics. A moving average is a statistical measure that smooths price data by calculating the average value over a specified period. The Russell 3000 Index measures the performance of the largest 3,000 publicly traded U.S. companies representing most of the investable U.S. equity market. The S&P 500 Index measures the performance of 500 large-capitalization U.S. companies. The MSCI Emerging Markets Index measures the performance of large- and mid-cap companies across emerging market countries. Nonfarm Payrolls represent the total number of paid U.S. workers excluding farm employees, government workers, private household employees, and nonprofit employees.
Please contact your AIM Regional Consultant for more information or to address any questions that you may have.
Algorithmic Investment Models LLC (AIM), 125 Newbury St. 4th Floor, Boston, MA 02116 (844-401-7699)