My ears couldn’t help but prick up recently when I heard a CNBC anchor mention a study of AI stock picking. Two employees at the United Kingdom arm of the website Finder, a website built to help consumers shop for financial services and products, asked ChatGPT to create them a stock portfolio. The resulting 38-stock portfolio was initiated on March 3, 2023. The results (as of 9/22/2025), which can be found here: ChatGPT stock picks vs 10 popular funds: Tracker, are fairly eye-popping, showing a 54.91% total return over the period for the “ChatGPT Basket” compared to an average 36.04% return for a basket of what they describe as the “ten most popular funds in the UK”.
I am a believer that AI/machine learning-based investment strategies can provide value to investors, seeing as that’s AIM’s core business and what I’ve dedicated the last nine years of my life to. However, for a few reasons I don’t believe that this study helps demonstrate the value.
I don’t believe they used an appropriate benchmark.
The ChatGPT basket was comprised of 38 almost entirely mainstream stocks, including Johnson & Johnson, Mastercard, Meta, Microsoft, Nvidia and more. Thirty-four of the 38 stocks are currently listed in the S&P 500. Three of the four that are not in the S&P 500 are Taiwan Semiconductor, ASML and Nestle, again mainstream stocks, leaving Illumina (ILMN) the most esoteric stock picked with a $14 billion market cap and currently followed by 22 analysts (i.e., not exactly off the beaten path).
It’s hard for me to imagine why they would not have just compared the ChatGPT Basket performance to the S&P 500 over the same period, given that the majority of the stocks are in the index and the ones that are not have close analogs there. The authors did mention that they asked ChatGPT for a quality portfolio (though they also included growth characteristics) and were seeking, as a comparison, products with a similar quality objective. So, I’ll give them the benefit of the doubt and take a quick look at their comparison group of 10 funds.
Two of the funds listed have less than 100% equity (80% and 60%). Additionally, three of the 10 funds listed have a Beta below 0.9. Right off the bat, this looks like a poor comparison group.
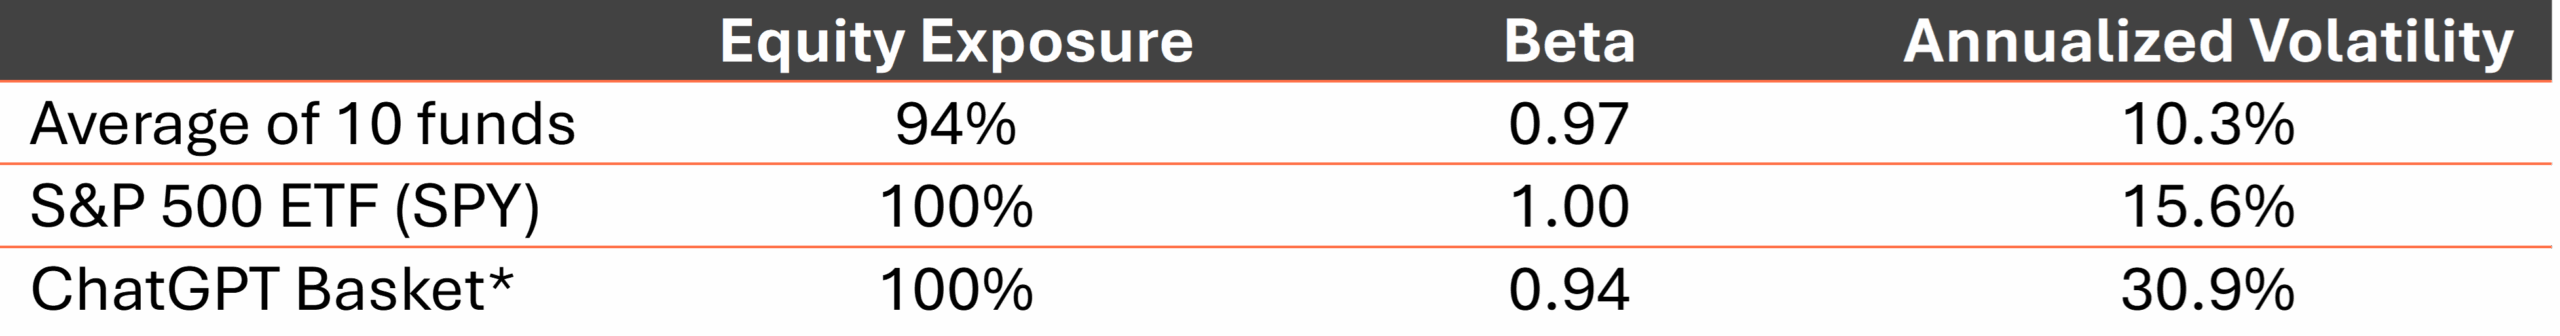 *Does not include Nestle, which I don’t have in my database of stock price histories due to it being listed on the Swiss Exchange. Data on SPY and the individual stocks are from Historical EOD Data analyzed by AIM. Data on the 10 funds cited in the report are from Morningstar Global. Data for the period 3/3/2023 through 9/22/2025.
While the ChatGPT Basket had a lower Beta than I expected, it appears to be because the portfolio was volatile and had a relatively low correlation to the S&P 500 (R2 = 0.47).
The authors reported that their comparison group of funds returned 36.04% on average. Over that same period, the S&P 500 returned 64.98% without including dividends and 71.12% when dividends are included.
The ChatGPT portfolio underperformed the S&P 500 by 10% with twice the volatility! This assumes they did not include dividends in their return computation – they did not say in the article and my own analysis suggests they may not have. Suddenly, the portfolio is not quite as impressive.
I do not believe they demonstrated that the performance is repeatable.
It’s not outright obvious to me that if I had prompted ChatGPT for a portfolio on the same day, that it would have recommended the same basket of stocks as it provided the authors even if I used identical prompt language. To generalize ChatGPT’s performance as a stock picker, I’d prefer a study in which a larger group of people each requested a portfolio in their own way with certain selection constraints applied. In my view, the average performance over this basket of ChatGPT portfolios would provide a better barometer for how well it performs at selecting stocks.
I don’t believe they implemented the right holding period.
The authors did not mention whether they gave ChatGPT a particular target holding period. Since they are comparing performance to popular broad market funds, they likely intended for a long-term buy and hold strategy. Even passive strategies rebalance occasionally, however.
At one point, the ChatGPT Basket was outperforming SPY by about 13% by my computations, which are different than the authors because they assume daily reweighting and exclude Nestle, which was a poor performer over the entire period and so results in better performance than the full basket of 38 stocks. This peak outperformance was, perhaps coincidentally, exactly a year after the portfolio was first purchased. A better strategy may be asking ChatGPT to suggest trades every 3 months or so to ensure the portfolio selections are fresh.
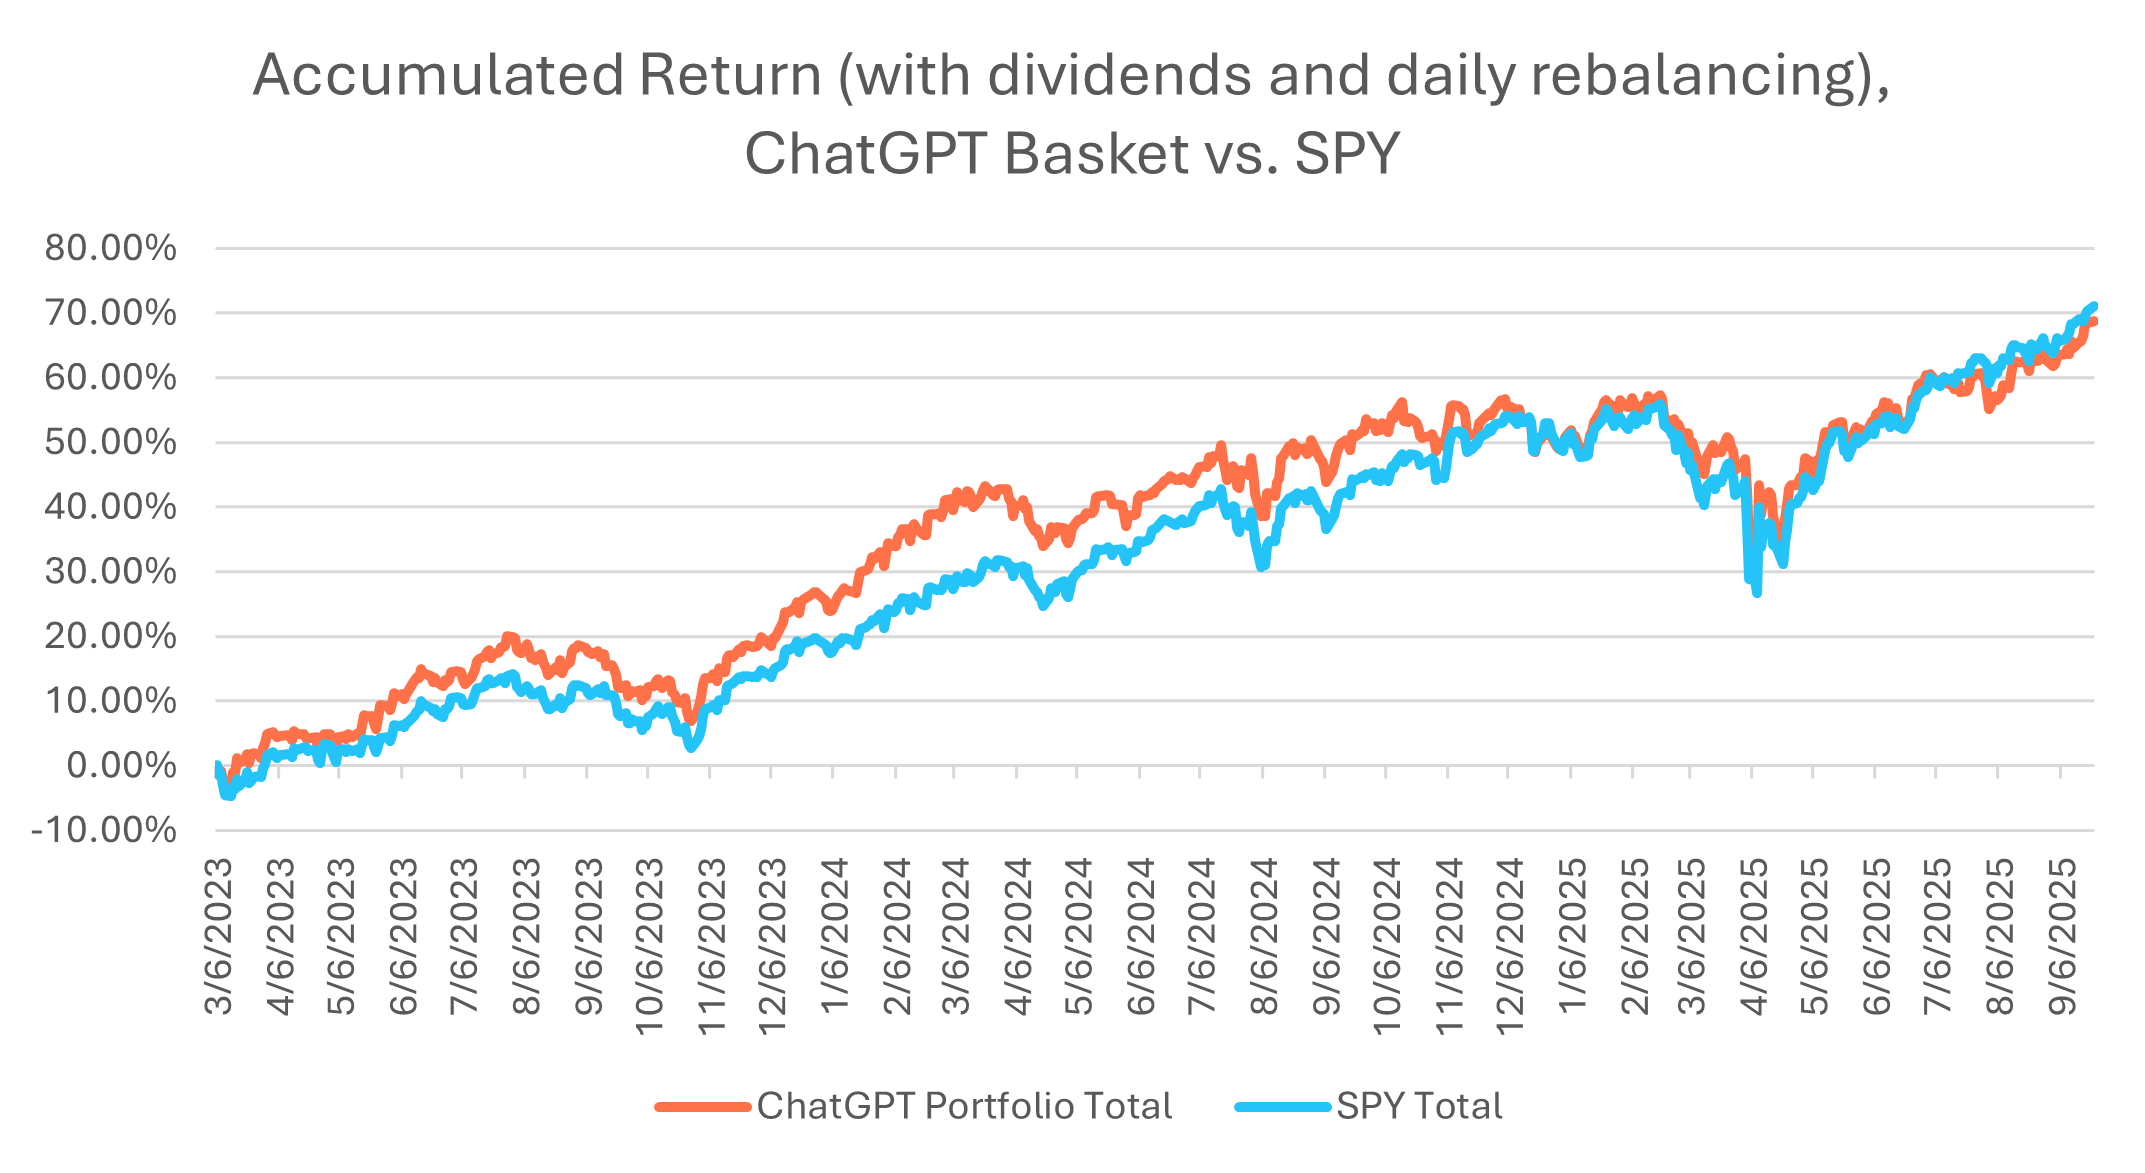 Source: Historical EOD data with internal analysis by AIM. We used daily rebalancing of the ChatGPT basket, adjusted returns for dividends, and assumed the purchase price for the basket was at the close on March 3, 2023. As a result, the total performance shown here is higher than the total performance presented in the article. For illustrative purposes only and does not represent any product or security. It is not possible to invest directly in an index. Past performance is not a guarantee of future results.
Conclusion
The authors rightfully caution their readers against using ChatGPT as a financial advisor. However, their touting of low-quality study results seems to betray that advice. We have high company standards about when and how to implement AI/machine learning-based security selections and the Finder study, as designed and presented, would not meet those standards. Still, we are deep believers in enhancing human decision making with the latest quantitative tools and will continue to explore where the latest innovations can help power better investment strategies.
Disclosures:
Copyright © 2025 Algorithmic Investment Models LLC. All rights reserved. All materials appearing in this commentary are protected by copyright as a collective work or compilation under U.S. copyright laws and are the property of Algorithmic Investment Models. You may not copy, reproduce, publish, use, create derivative works, transmit, sell or in any way exploit any content, in whole or in part, in this commentary without express permission from Algorithmic Investment Models.
Certain information contained herein constitutes “forward-looking statements,” which can be identified by the use of forward-looking terminology such as “may,” “will,” “should,” “expect,” “anticipate,” “project,” “estimate,” “intend,” “continue,” or “believe,” or the negatives thereof or other variations thereon or comparable terminology. Due to various risks and uncertainties, actual events, results or actual performance may differ materially from those reflected or contemplated in such forward-looking statements. Nothing contained herein may be relied upon as a guarantee, promise, assurance or a representation as to the future.
This material is provided for informational purposes only and does not in any sense constitute a solicitation or offer for the purchase or sale of a specific security or other investment options, nor does it constitute investment advice for any person. Specific company references provided herein are for illustrative purposes only and are not a recommendation to buy, sell or hold any security
The material may contain forward or backward-looking statements regarding intent, beliefs regarding current or past expectations. The views expressed are also subject to change based on market and other conditions. The information presented in this report is based on data obtained from third party sources. Although it is believed to be accurate, no representation or warranty is made as to its accuracy or completeness.
The charts and infographics contained in this blog are typically based on data obtained from third parties and are believed to be accurate. The commentary included is the opinion of the author and subject to change at any time. Any reference to specific securities or investments are for illustrative purposes only and are not intended as investment advice nor are they a recommendation to take any action. Individual securities mentioned may be held in client accounts. Past performance is no guarantee of future results.
As with all investments, there are associated inherent risks including loss of principal. Stock markets, especially foreign markets, are volatile and can decline significantly in response to adverse issuer, political, regulatory, market, or economic developments. Sector and factor investments concentrate in a particular industry or investment attribute, and the investments’ performance could depend heavily on the performance of that industry or attribute and be more volatile than the performance of less concentrated investment options and the market as a whole. Securities of companies with smaller market capitalizations tend to be more volatile and less liquid than larger company stocks. Foreign markets, particularly emerging markets, can be more volatile than U.S. markets due to increased political, regulatory, social or economic uncertainties. Fixed Income investments have exposure to credit, interest rate, market, and inflation risk. Diversification does not ensure a profit or guarantee against a loss.
Beta is a number describing the relation of its returns with those of the financial market as a whole. A positive beta means that the asset’s returns generally follow the market’s returns. A negative beta means that the asset’s returns generally move opposite the market’s returns. Annualized volatility represents the degree of variation in an asset’s returns over a year, indicating its risk level. Correlation measures how closely two assets move together in price.
Algorithmic Investment Models LLC (AIM)