Despite record earnings per share, tech giants are dramatically increasing their spending—moves that could reshape the economics of their businesses. The short- and long-term impacts of new tariffs are expected to vary drastically by industry. U.S. equities are lagging global peers by the largest margin in over 30 years. Home-purchase cancellations are rising. And Hurricane Erin has temporarily given East Coast surfers waves on par with, or better than, Southern California.
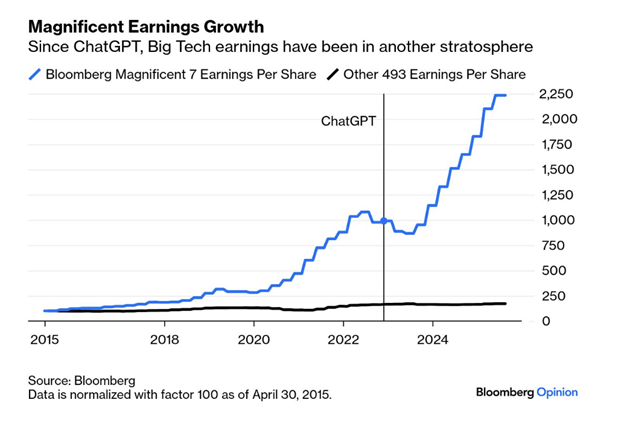
1. The Magnificent 7 have led the market for good reason:
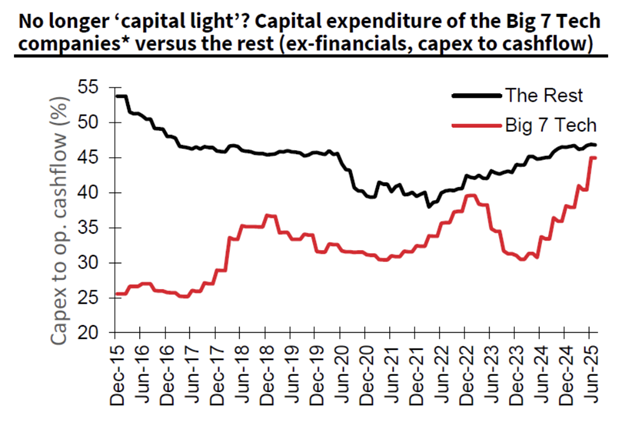
2. But their massive increase in spending has the prospect of changing the economics of their business going forward:
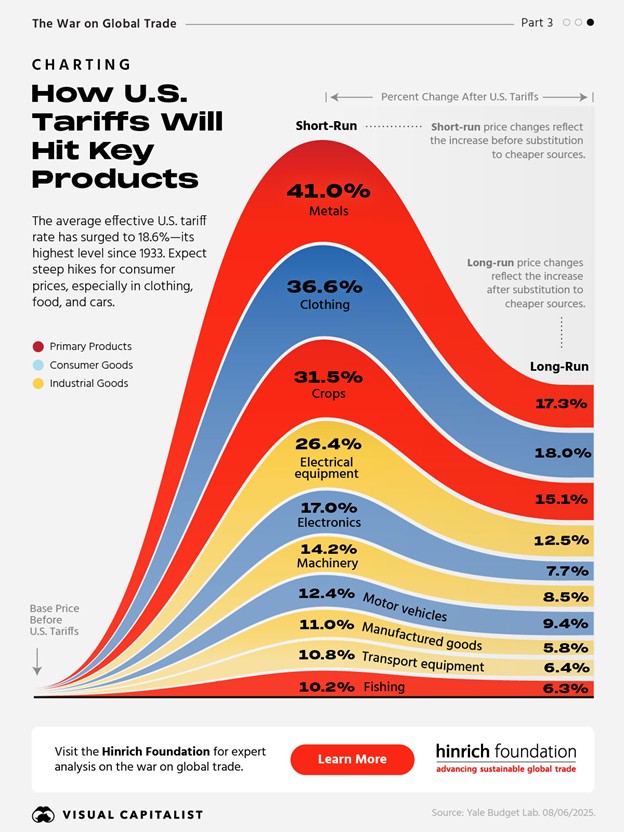
3. Tariffs will effect different industries differently and take time to mitigate:
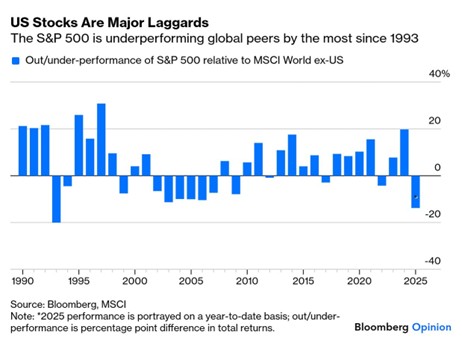
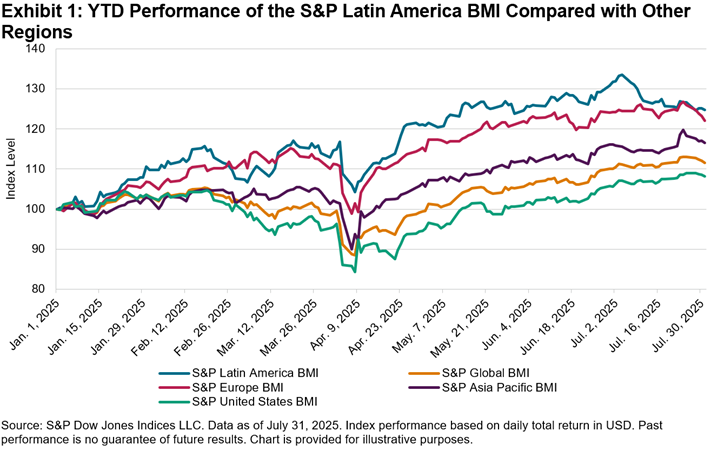
4. Despite the 8.3% gain in the S&P 500 this year, the U.S. is significantly underperforming other international markets.
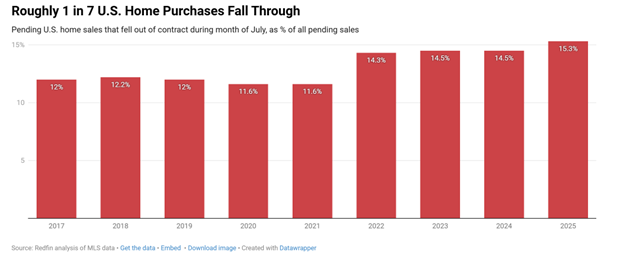
5. More and more home purchases are falling through
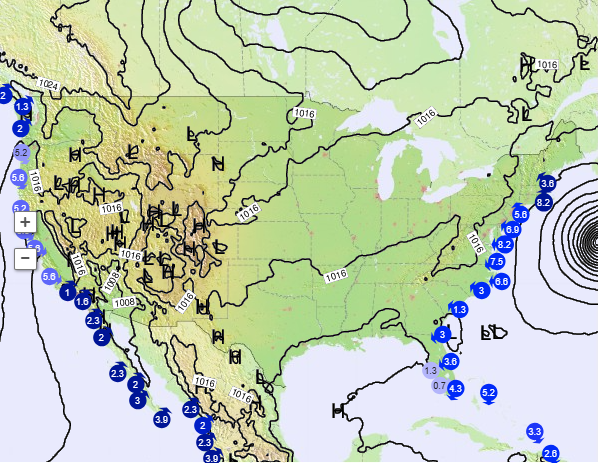
6. While Hurricane Erin is closing beaches across the East Coast surfers have reason to celebrate as surfing conditions exceed those across top spots in Southern California
Disclosures:
Copyright © 2025 Algorithmic Investment Models LLC (AIM). All rights reserved. All materials appearing in this commentary are protected by copyright as a collective work or compilation under U.S. copyright laws and are the property of Beaumont Capital Management. You may not copy, reproduce, publish, use, create derivative works, transmit, sell or in any way exploit any content, in whole or in part, in this commentary without express permission from Beaumont Capital Management.
Certain information contained herein constitutes “forward-looking statements,” which can be identified by the use of forward-looking terminology such as “may,” “will,” “should,” “expect,” “anticipate,” “project,” “estimate,” “intend,” “continue,” or “believe,” or the negatives thereof or other variations thereon or comparable terminology. Due to various risks and uncertainties, actual events, results or actual performance may differ materially from those reflected or contemplated in such forward-looking statements. Nothing contained herein may be relied upon as a guarantee, promise, assurance or a representation as to the future.
This material is provided for informational purposes only and does not in any sense constitute a solicitation or offer for the purchase or sale of a specific security or other investment options, nor does it constitute investment advice for any person. The material may contain forward or backward-looking statements regarding intent, beliefs regarding current or past expectations. The views expressed are also subject to change based on market and other conditions. The information presented in this report is based on data obtained from third party sources. Although it is believed to be accurate, no representation or warranty is made as to its accuracy or completeness.
The charts and infographics contained in this blog are typically based on data obtained from third parties and are believed to be accurate. The commentary included is the opinion of the author and subject to change at any time. Any reference to specific securities or investments are for illustrative purposes only and are not intended as investment advice nor are they a recommendation to take any action. Individual securities mentioned may be held in client accounts. Past performance is no guarantee of future results.
As with all investments, there are associated inherent risks including loss of principal. Stock markets, especially foreign markets, are volatile and can decline significantly in response to adverse issuer, political, regulatory, market, or economic developments. Sector and factor investments concentrate in a particular industry or investment attribute, and the investments’ performance could depend heavily on the performance of that industry or attribute and be more volatile than the performance of less concentrated investment options and the market as a whole. Securities of companies with smaller market capitalizations tend to be more volatile and less liquid than larger company stocks. Foreign markets, particularly emerging markets, can be more volatile than U.S. markets due to increased political, regulatory, social or economic uncertainties. Fixed Income investments have exposure to credit, interest rate, market, and inflation risk. Diversification does not ensure a profit or guarantee against a loss.
The S&P 500 is a stock market index that tracks the performance of 500 of the largest publicly traded companies in the United States, while the MSCI World ex-U.S. Index measures equity performance across 22 developed markets excluding the United States. The S&P Latin America BMI captures publicly listed companies across major Latin American markets, the S&P Europe BMI measures equities across both developed and emerging European markets, and the S&P Asia Pacific BMI does the same across Asia and the Pacific. The S&P Global BMI is a comprehensive benchmark covering equities across developed and emerging markets worldwide, while the S&P United States BMI represents the investable universe of publicly traded companies domiciled in the U.S., providing broad coverage of the U.S. equity market.
Please contact your AIM Regional Consultant for more information or to address any questions that you may have.
Algorithmic Investment Models LLC (AIM), 125 Newbury St. 4th Floor, Boston, MA 02116 (844-401-7699)