

3Q26 Quarterly Commentary
The broad market hasn’t materialized, but winners have been more scattered than the last few years.
It is hard to believe as the daylight wanes more with each passing day that we hadn’t yet celebrated the 4th of July when the prior quarter began. Maybe the stark seasonal change here in New England has further exacerbated those feelings. Nonetheless the third quarter felt long, and it felt weird if you were paying attention to markets. As weird as the quarter was, it was a strong one for all of our Decathlon strategies. Each risk level delivered positive returns while each of their benchmarks had negative returns in the quarter due to a combination of slightly positive global equities (+1.1%) and a strongly negative quarter for fixed income (-3.5%)[1]. The strong strategy performance builds on what has been a strong year, but not for the reasons we might have anticipated when the year began.
The keys to our strategies’ success thus far in the year have come down to addressing two distinct challenges that the year has presented.
- How to get performance without AI exposure and
- How to reduce risk without fixed income exposure.
Our hope when the year began was that we’d be looking at a much broader market, one in which many sectors outperformed the index – a fertile hunting ground for active management. While that hope was strengthened in the first quarter, it has faded substantially in the second two. What we have seen instead is a scattered market. A scattered market is one where few things outperform, but the winners are scattered and unrelated to each. If the market broadens, as it often has after period of extreme concentration, that would be an additional tailwind for our strategies beyond what they have delivered so far.
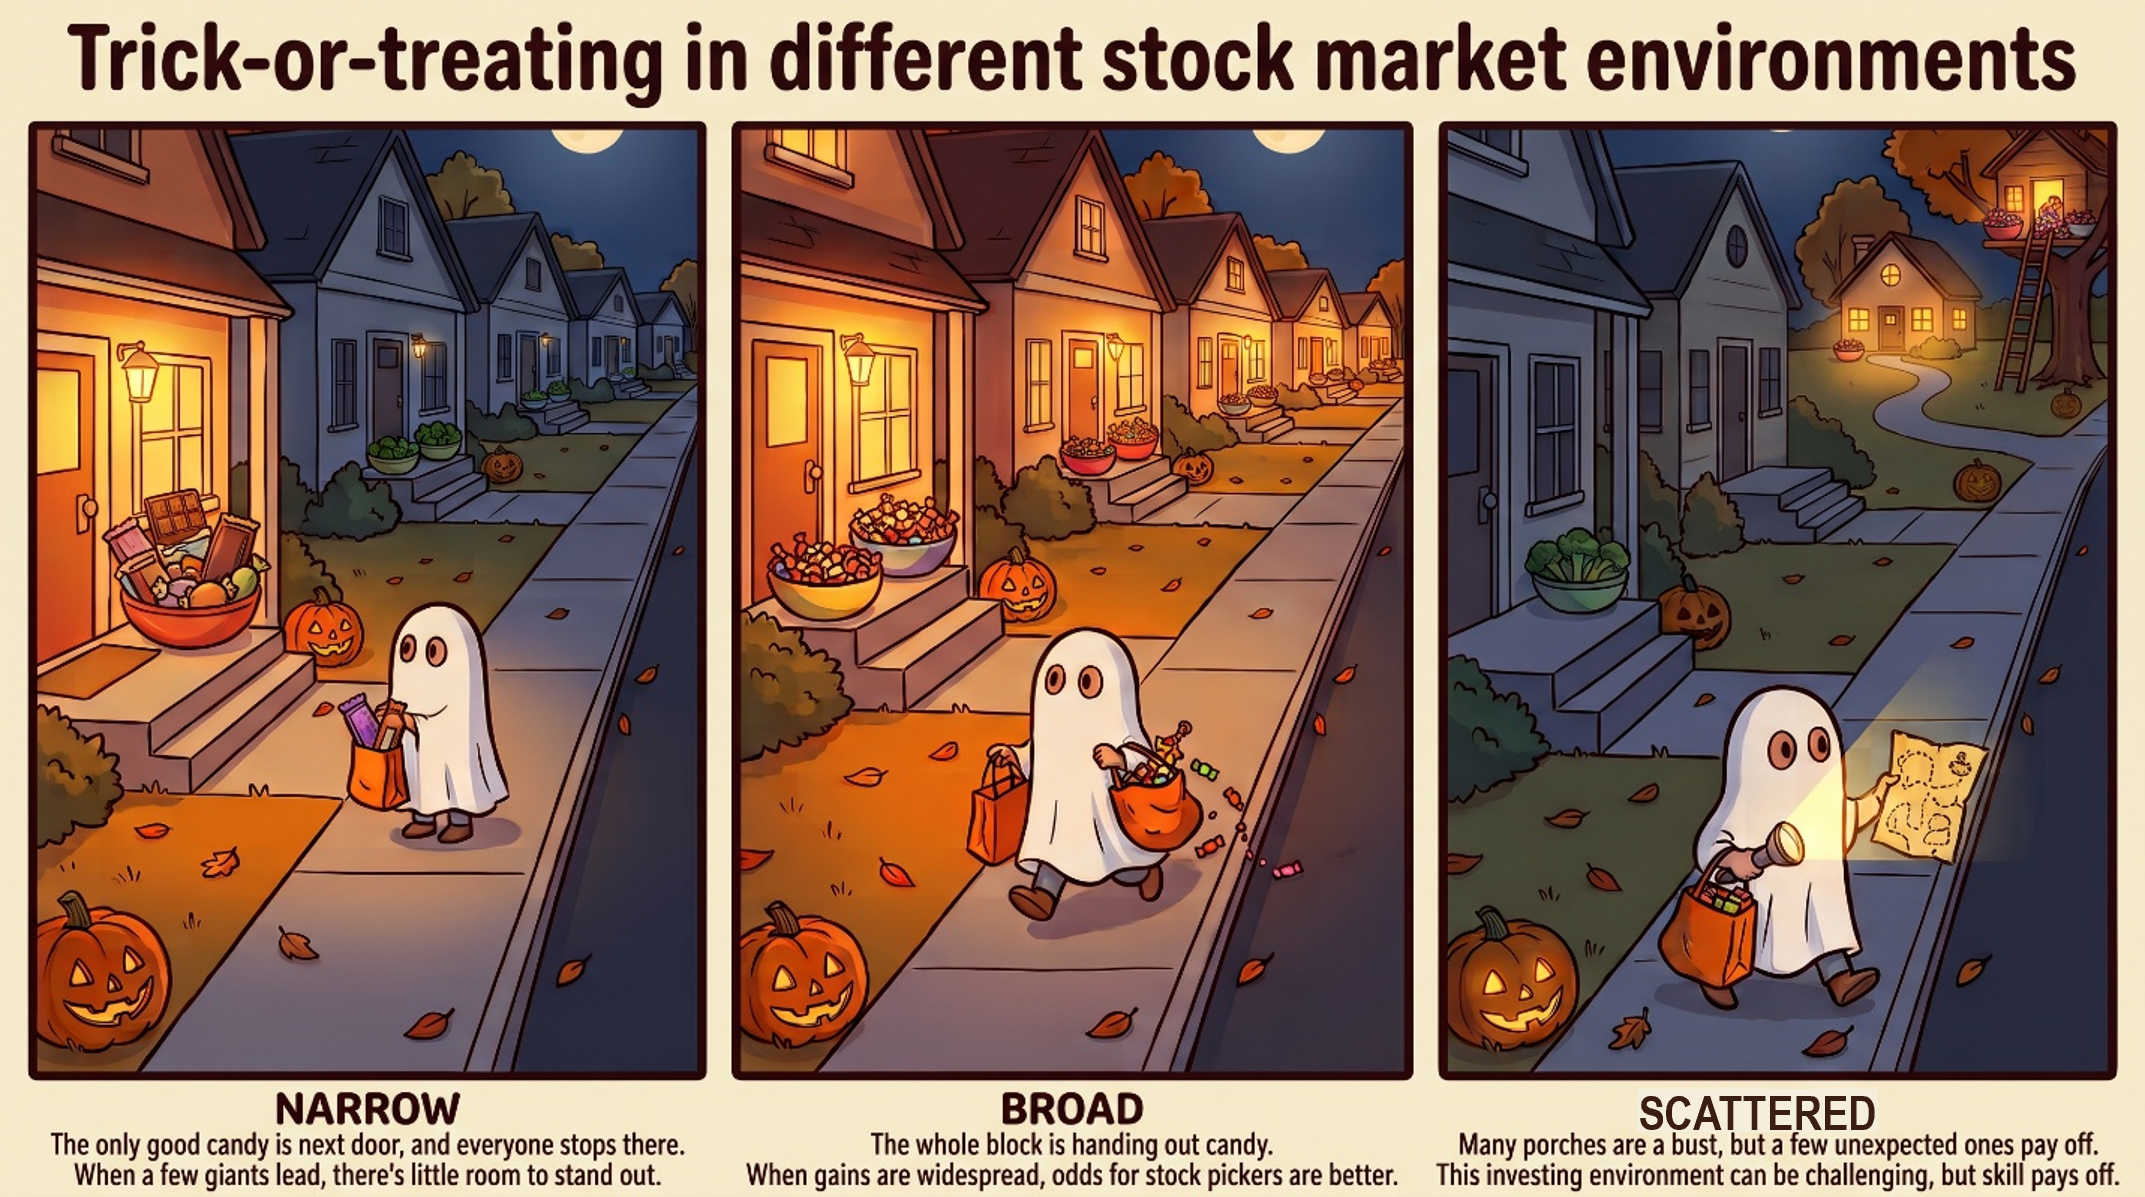
Cap-weighted indices have substantially outperformed equal-weighted indices, but there have been other unrelated pockets of strength outside the largest companies. A scattered market is not an easy market for an active manager (like one could say a broad market is), but it provides opportunities for successful active management and has played to our differentiated strengths.
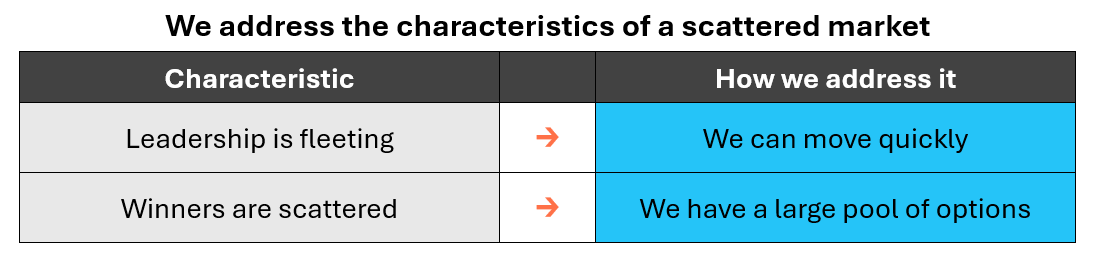
Two trades we’ve made this year show how quickly leadership has shifted, and why a broad set of options matters. Biotech and Clean Energy have little in common with each other or with the broader market (though Clean Energy was arguably our closet AI exposure earlier in the year), yet both were among the strongest contributors to our more aggressive strategies this year. Our system sold Biotech in August, very close to what would be its high on the year. The sector then fell 4.5% through the quarter[2] and has extended losses so far in October. Remarkably, Biotech has contributed more to performance than Energy, which we have held all year, and which remains one of the best-performing equity sectors, ending the quarter near its highs. Clean Energy followed a similar path: a meaningful winner earlier in the year, sold in June, and now back near its lows. Not every trade worked. When the system signaled a return to Clean Energy via the Solar sector in the third quarter, our entry was poorly timed and produced a small loss. The solar subsector was one of the larger detractors in our Moderate strategy during the quarter. The exit, however, was not regrettable as the sector has fallen substantially further. When leadership rotates this quickly among unrelated corners of the market, a large pool of options and the ability to act on it quickly have and should remain if this environment persists.
It was a weird quarter.
At the end of last quarter, we cited the massive uptick in volatility amongst the AI archetype Semiconductors sector, noting this was likely a headwind going forward and why our quantitative system might be avoiding them despite their historic momentum. This proved correct, and the group fell by double digits, with a drawdown of nearly 30% from June 22nd through the end of July[3].
What we wouldn’t have anticipated was that Global stocks would end the quarter positive in the face of the largest sub-sectors’ stark decline.[4] The very largest companies in the index managed to pull all of the weight for the index. In other oddities, the riskiest stocks (of which semiconductors are also a huge component) slightly outperformed their less risky counterparts – both of which declined[5]. What looks like a relatively ho-hum positive quarter for global stocks was actually a historically un-even quarter for the components therein, with substantial damage under the surface. Almost no sub-group of the major market equity indices performed similarly to the index itself, and the majority had negative returns.
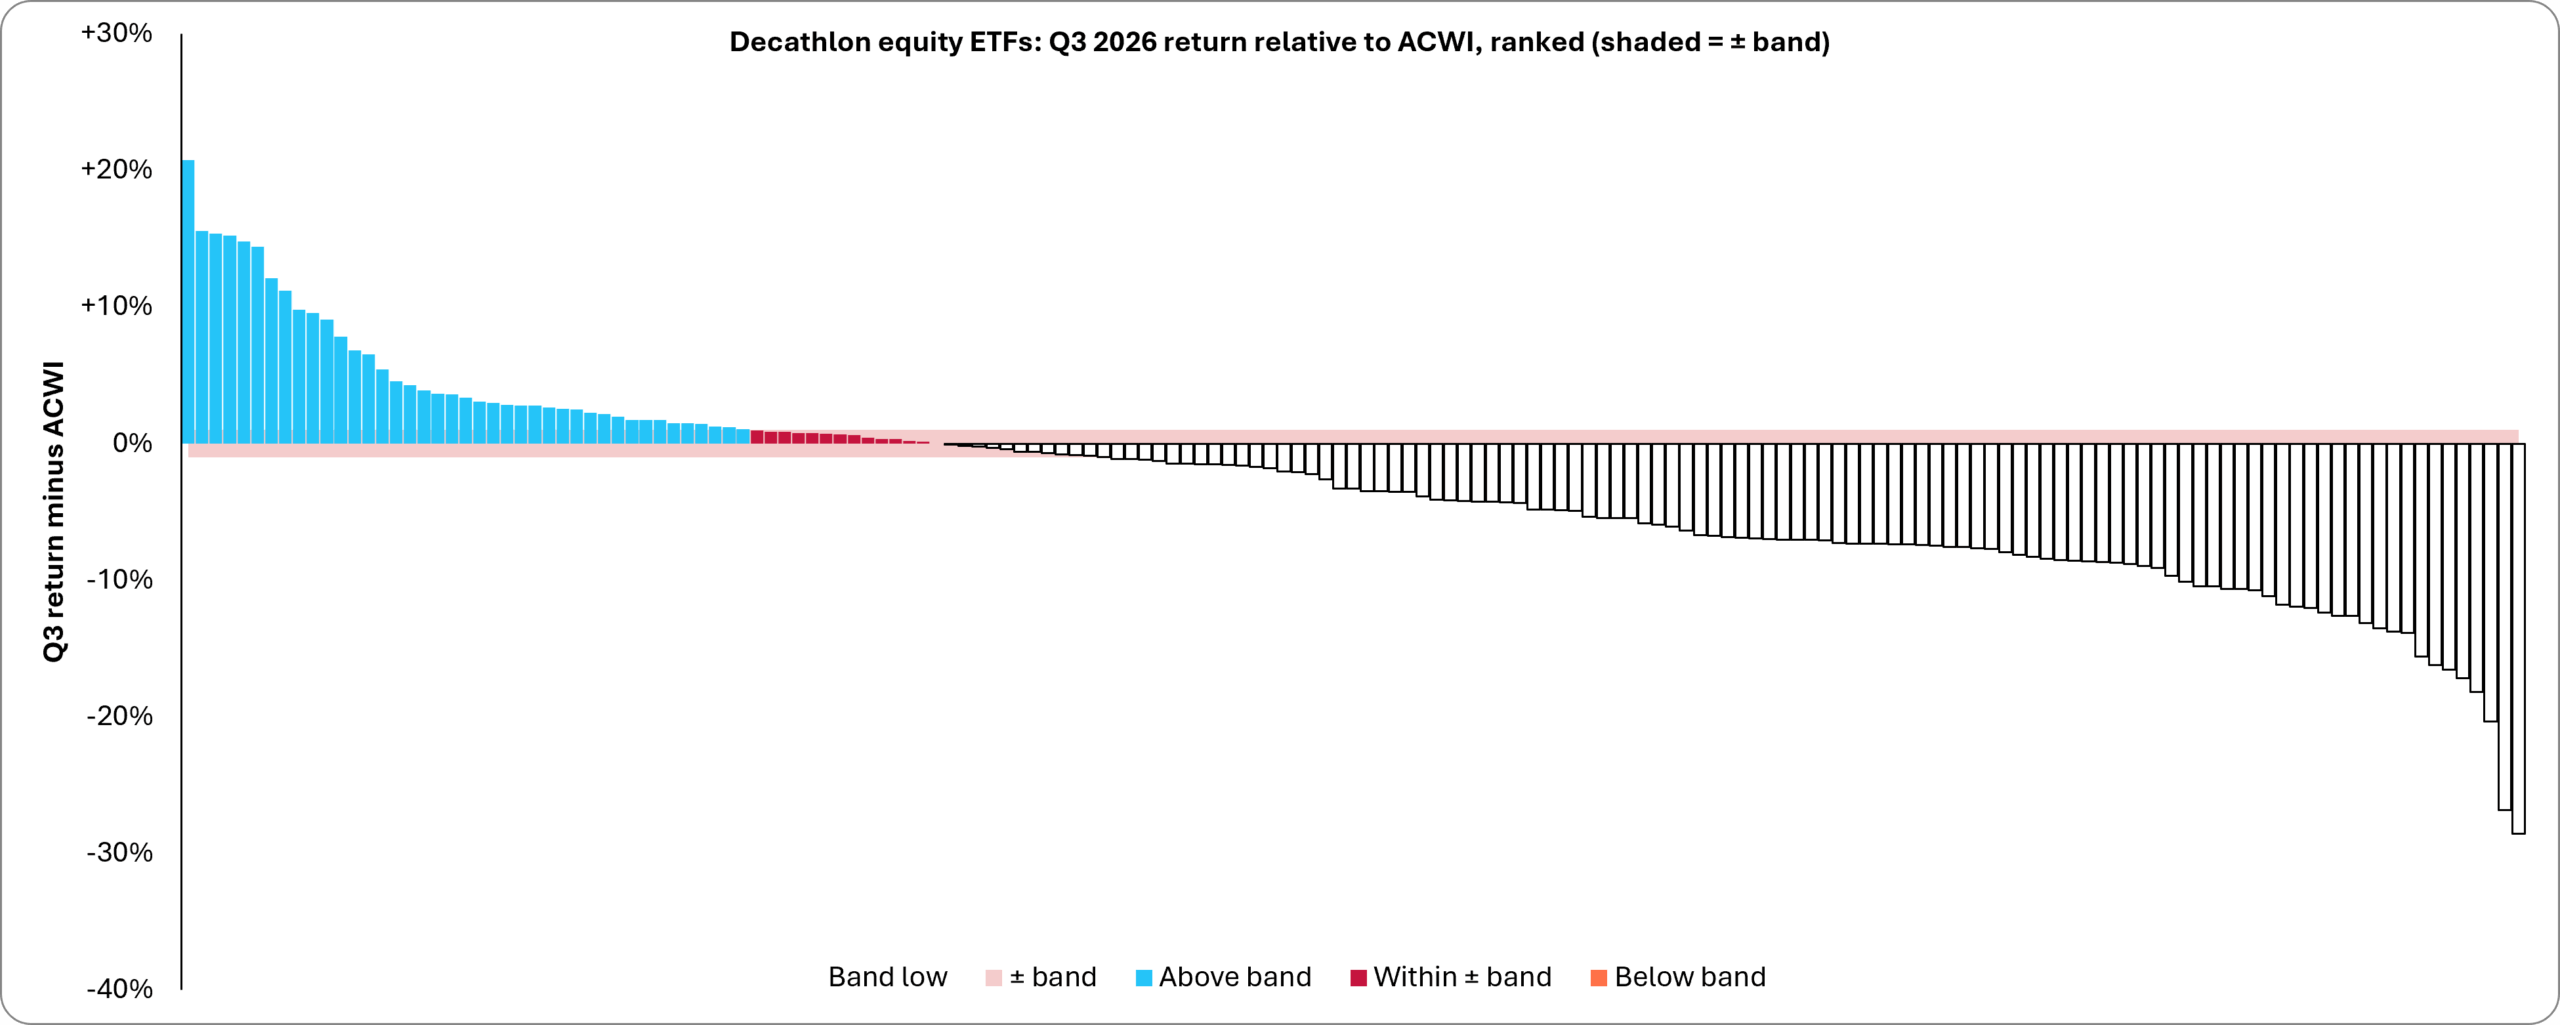 Source: AIM internal data, 6/30/26 to 9/30/26
Perhaps part of what contributed to my perceived “length” of the quarter was that little new material economic events occurred. Instead, many of the ongoing economic pressures we’ve seen throughout the year persisted against expectations of possible relief. This is most acute within Energy as investors have continually priced in some expectation of a swift resolution to the supply bottlenecks caused by the Iran war. As that has not materialized, higher commodity prices have continued to flow through to broader inflationary pressures. Leading investors to believe the Fed will have to keep rates higher for longer and driving real interest rates to record levels by the end of the quarter.
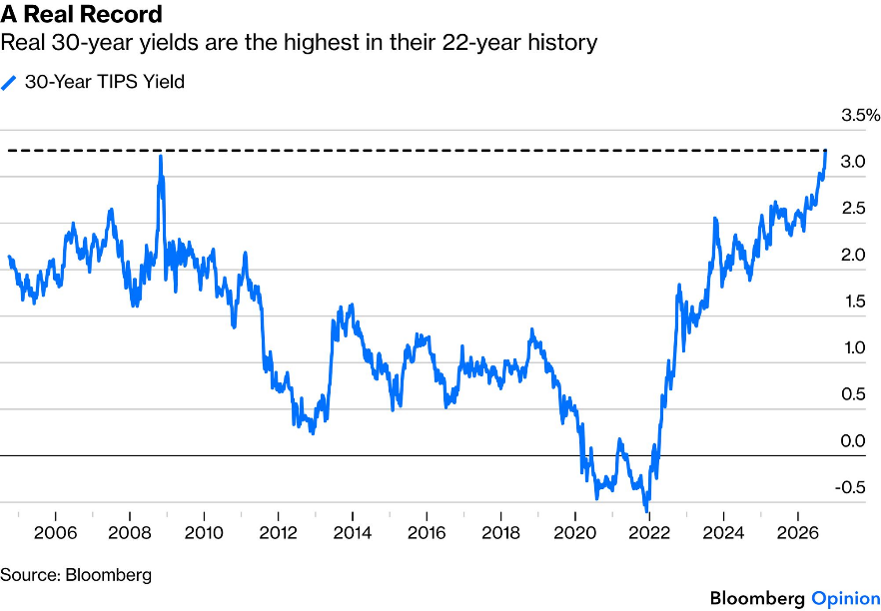
So, what explains the quarter’s weird market behavior? Our primary answer is the chart above. Real interest rates, the yield on bonds after inflation, surged to their highest level in more than two decades. Higher real rates affected the markets in three ways.
- Economically sensitive sectors, like housing, lost momentum as borrowing costs rose.
- Lower-risk, bond-like equities lost appeal now that bonds themselves offered a competitive real return, likely explaining the odd difference in lower risk equities and higher beta ones in the quarter.
- And the largest technology companies, whose prospects depend far more on the AI cycle than financing costs, were comparatively insulated, providing a source of comfort for investors to gravitate towards.
A significant secondary factor was a sharp turn in public sentiment against AI. When the people building a technology that the public is already highly skeptical of, warn that it might kill all of us within 10 years, that understandably causes a stir[6]. AI stocks are unusually sensitive to stories. The present is known, most AI complex companies have seen their profits surge. What markets are debating is how long that growth can last. Because the debate is about the future, these stocks tend to move on shifts in narrative more than on reported results, especially in the months between earnings reports, this adds to their volatility. As the “AI safety” narrative took hold investors decreased their odds for future growth and punished many of the AI infrastructure companies accordingly.
Capitalizing on a scattered market.
The sheer scale of investment and the size of the companies involved is clearly distorting the equity market. Global stocks can now be thought of as a large cohort of AI-related investments and a bucket of “other”. The AI portion is large and more volatile than the “other” bucket, so it contributes most of the risk. For passive investors, their experience over the next few years will be driven by the outcome for these AI-related equities.
For many active investors they have likely felt as though they have one choice to make – how much weight should they place within the “AI bucket”. All of this has reduced focus on the “other” segment which has had surprising pockets of strength in 2026.
Meanwhile, AI is having an additional effect on fixed income as it has added to inflationary pressures in the economy. An economy with inflation concerns is one in which fixed income not only performs poorly but also provides no hedge for equities (as has been the case this year). In fact, due to the oddities and power of the AI cycle, fixed income is now more correlated with the S&P 500 than the average S&P 500 stock is to one another, and a historic number of S&P 500 stocks are actually negatively correlated with the index – they go up when the index goes down and vice versa.
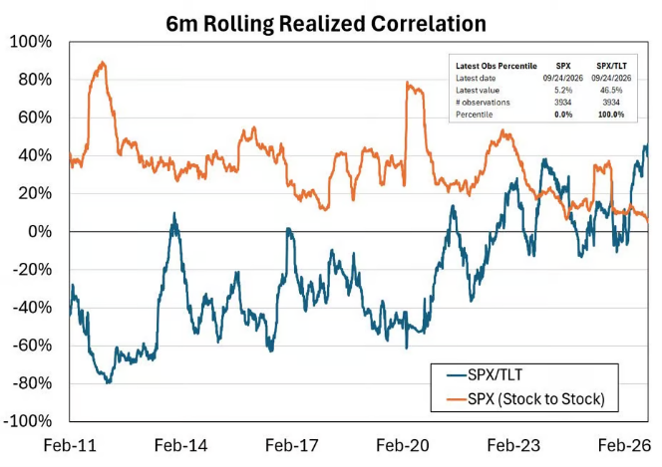
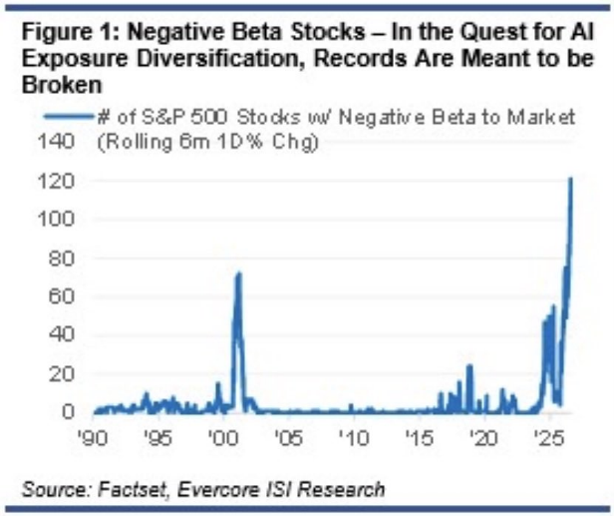
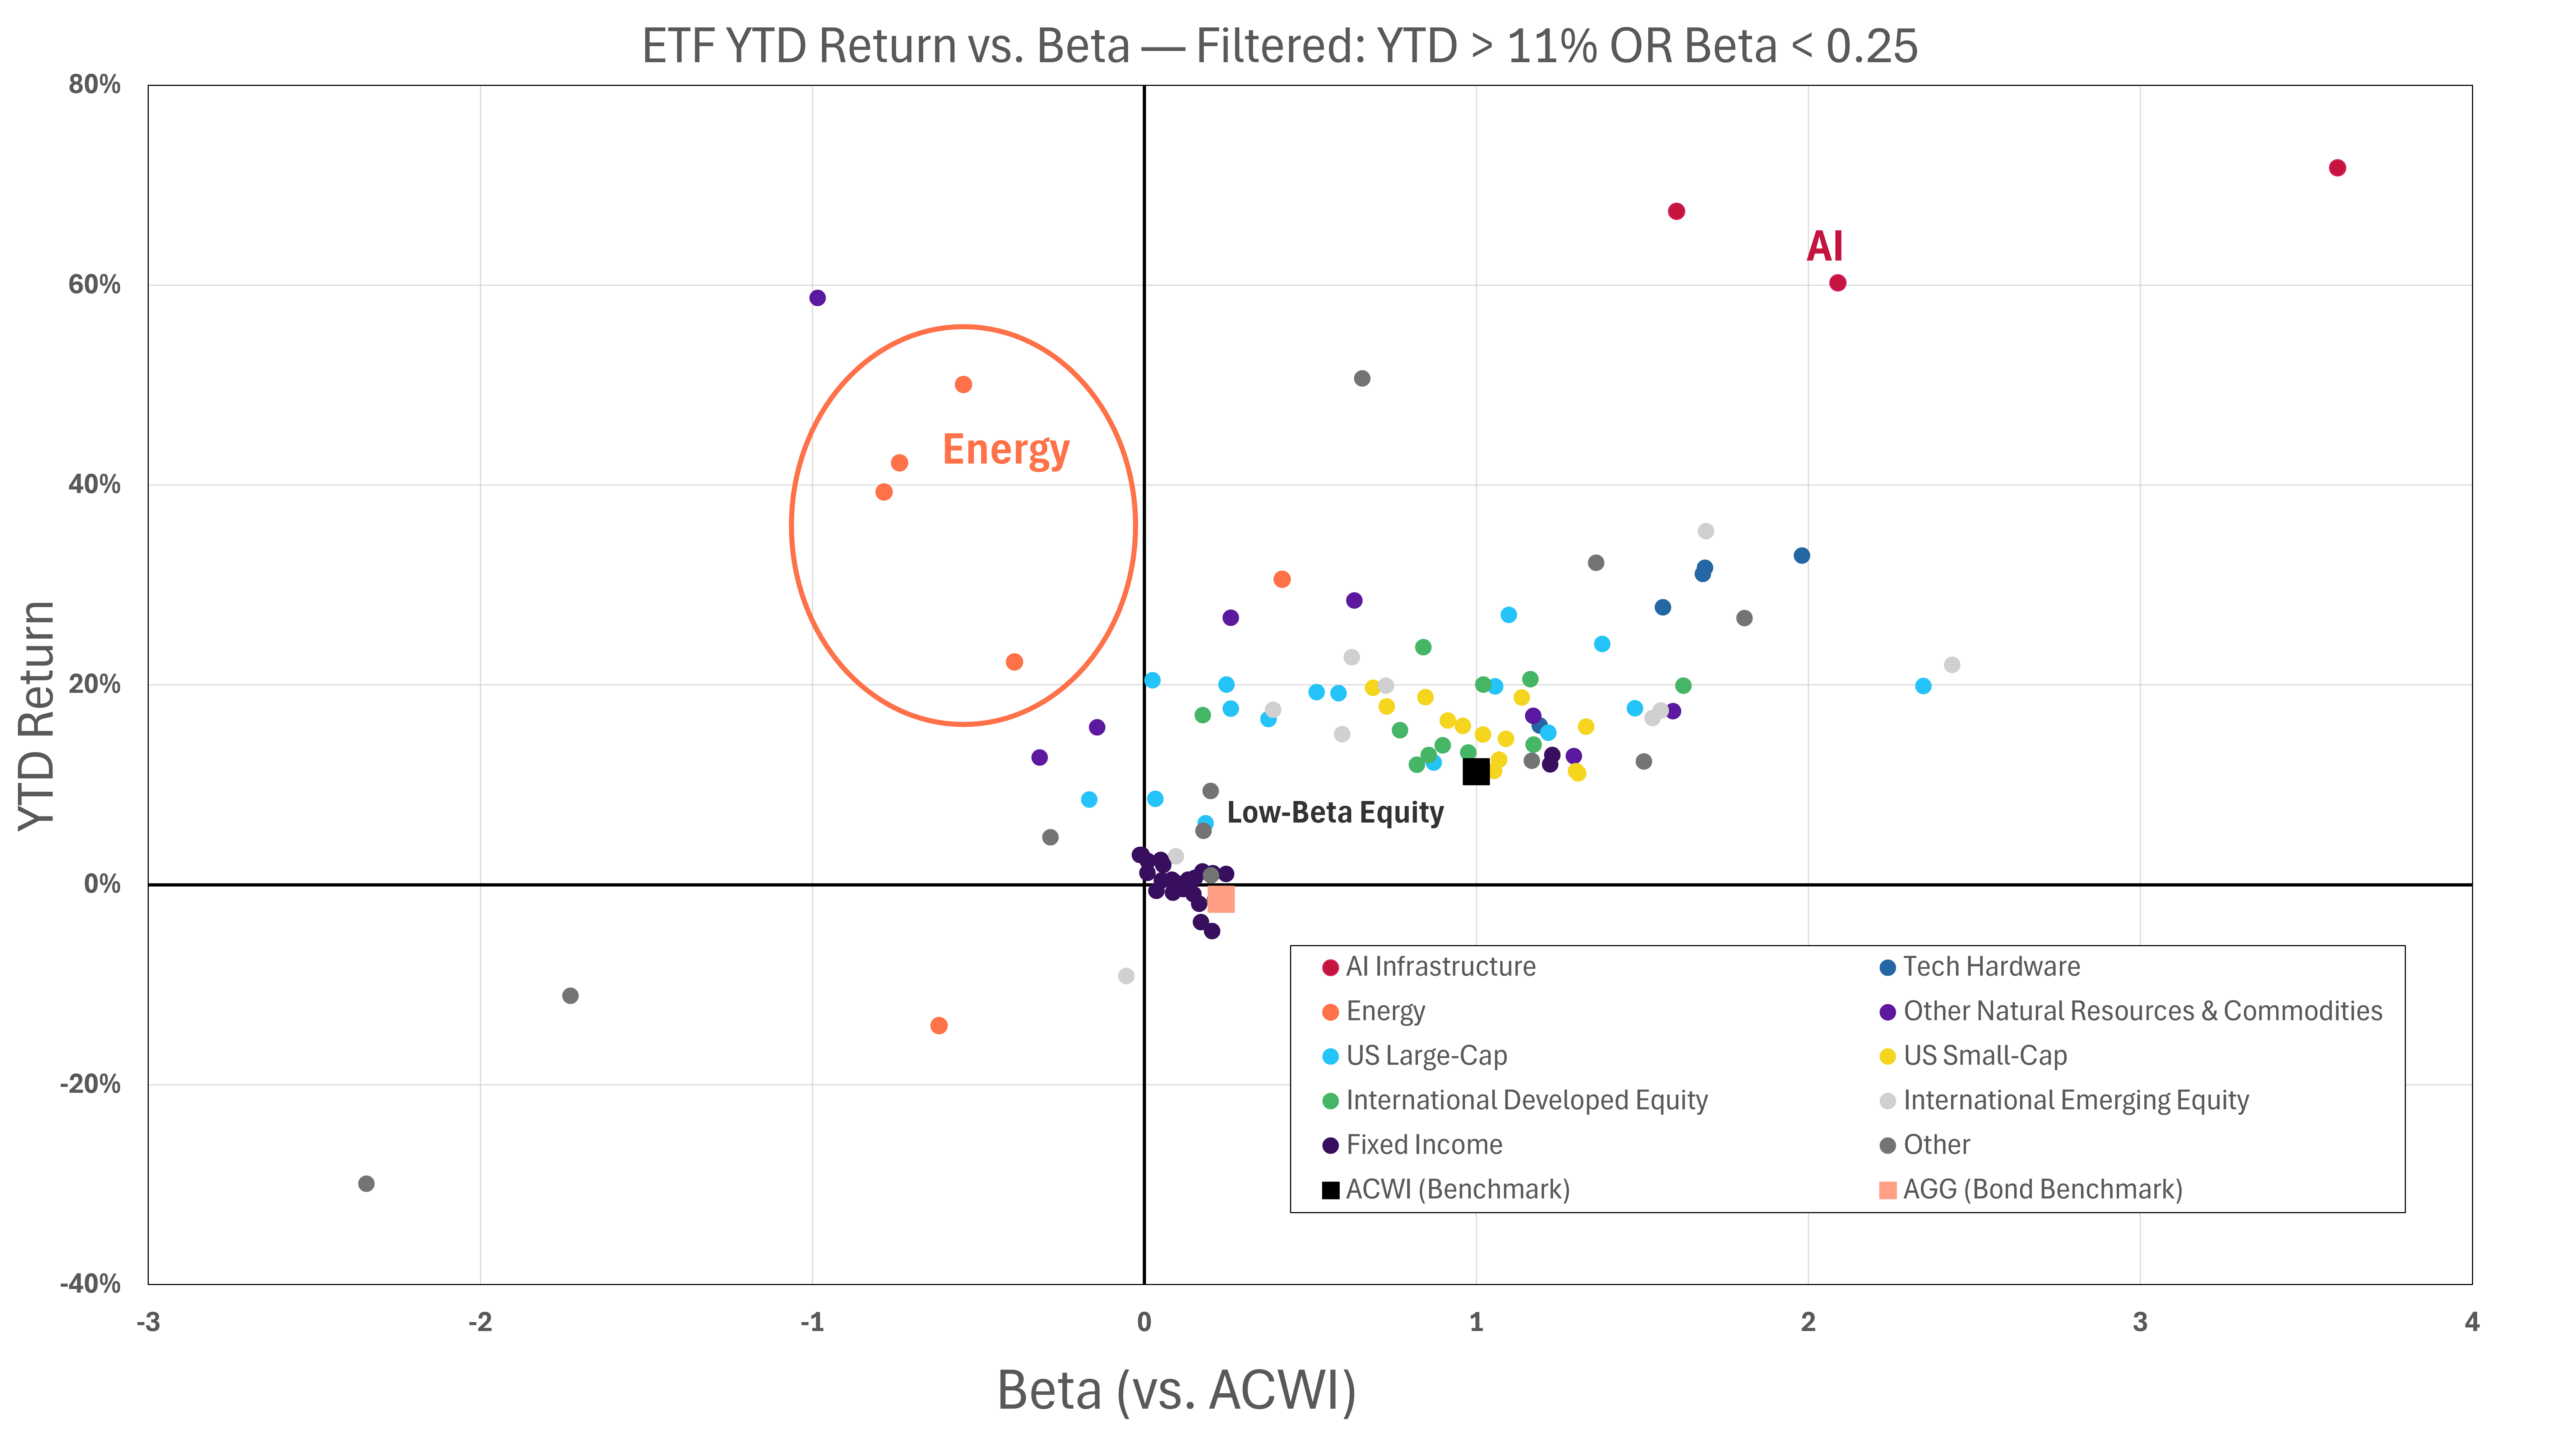
The combined effect creates an admirable goal for active investors, and one which our strategies have achieved this year: finding return outside of AI and reducing risk outside of fixed income. While Energy has successfully done both simultaneously, the chart below, which captures everything in our diverse pool of 240 ETFs that have either beaten the market or had less correlation to it than bonds, shows that the opportunity set has been larger than one might expect. In fact, in a market where the average stock is not particularly correlated with the index, it is quite easy to reduce risk relative to the index – you can simply buy other equities rather than fixed income. The challenge has been in selecting the correct equities and trading in and out of them as they ebb and flow, a challenge our system is well suited for.
 Source: AIM internal data, 6/30/26 to 9/30/26
If economic growth returns as the predominant economic risk (as opposed to inflation) as it was for most of the pre-2020 post 2008 period, fixed income will retain its valuable properties, but so far a strategy which selected an eclectic mix of non-AI equity, if well chosen, has delivered performance with very little equity market risk.
The chart above closely aligns with the characteristics that our own strategies have sought throughout the year: Consistent energy exposure, a diversified basket of less controversial equities, minimal and if any short-duration fixed income exposure, and avoidance of AI related equities due to the outsized volatility.
Process improvements bearing fruit.
Our quantitative process is always evolving, and periodically we make larger, generational upgrades that are monitored in real-time before they replace our existing models. Earlier this year we began testing our latest generation: “beta-targeted” models, built around a target level of market risk rather than volatility alone. The bigger improvement is “under the hood” – a new set of “conditional” variables, built with machine learning that effectively give the models more context. A particular price pattern may have different outcomes in different circumstances, for example a certain type of behavior in a calm market might have a different predicted outcome than it would in a volatile market. A conditional variable can help the system distinguish between the two. [7]
Both generations have performed well in 2026, but over nine months of live results the new models’ rankings have meaningfully outperformed their predecessors. Constant improvement is a necessary part of our process but if the current model results continue, it should translate into better strategy performance as we begin incorporating them into our final portfolios.
Understanding the strange market.
As weird a quarter and year as it has been, it is certainly comforting that our strategies have navigated well, but environments can change.
Energy in particular has delivered for our strategies, but it could present a risk if supply issues suddenly abate. One advantage of the prolonged supply crises is that it has made a sudden shift less likely, and without a sudden shift, forward looking markets can hopefully do a good job of discounting the outlook for Energy stocks and give our system a true signal with which to evaluate them (that is to say, we expect they’ll take the stairs down rather than the elevator if the tide turns).
Recently we’ve been able to buy traditionally defensive sectors on the strange weakness they exhibited in Q3 without having to suffer from that weakness ourselves. Time will tell if those prove to be opportunistic purchases, but the ability to move quickly among a wide variety of opportunities appears to remain a key to success in the current environment.
Nearly every major anomaly we have highlighted over the past few quarters has presented a comparison to the tech bubble period. This is an obvious historical analogy, with important caveats of course, but if it plays out similar in the market, at some point the opportunity to move outside indices will present massive advantages beyond those we have seen this year – the broadening will eventually come to fruition. Concentration is a characteristic of nearly every market cap index equity peak throughout history and is likely to be in the next one as well whenever it occurs. We currently sit in one of the most concentrated equity markets in history.
We are extremely pleased that we have delivered strong results while we await further tailwinds for our strategy versus indices. Thank you for your continued interest in and support of our products.
[1] Bloomberg: 6/30/2026 – 9/30/2026, Bloomberg
[2] Source: Bloomberg, XBI ETF, 8/5/2026 – 9/30/2026.
[3] Source: Bloomberg, SOXX ETF, drawdown from 6/22/26 to 7/29/26 was 29%.
[4] Source: Bloomberg, 6/30/2026 – 9/30/2026. High beta stocks represented by SPHB were down 3% on the quarter while low-vol stocks represented by USMV were down 5%
[5] Source: Bloomberg, 6/30/2026 – 9/30/2026. High beta stocks represented by SPHB were down 3% on the quarter while low-vol stocks represented by USMV were down 5%
[6] Evan Hubinger, alignment-science lead at Anthropic, post on X, September 2026: “I personally think it is >10% within the next decade.” As reported in “Anthropic researcher says AI has over 10% chance to ‘kill all humans’ within next decade,” Fox Business, September 2026.
[7] More technically this introduces non-linearity into the models to better fit how real data comes at us. Real data is not orderly and step-by-step predictive; it’s unordered and multi-dimensional and so introducing multi-dimensional variables can give the models tools to better approximate a real-world data environment. We have intentionally tried to be brief here so if you are interested in learning more about how we create these new variables and what we think the advantages of them are please reach out to us directly.
Disclosures:
Copyright © 2026 Algorithmic Investment Models LLC. All rights reserved. All materials appearing in this commentary are protected by copyright as a collective work or compilation under U.S. copyright laws and are the property of Algorithmic Investment Models. You may not copy, reproduce, publish, use, create derivative works, transmit, sell or in any way exploit any content, in whole or in part, in this commentary without express permission from Algorithmic Investment Models.
Certain information contained herein constitutes “forward-looking statements,” which can be identified by the use of forward-looking terminology such as “may,” “will,” “should,” “expect,” “anticipate,” “project,” “estimate,” “intend,” “continue,” or “believe,” or the negatives thereof or other variations thereon or comparable terminology. Due to various risks and uncertainties, actual events, results or actual performance may differ materially from those reflected or contemplated in such forward-looking statements. Nothing contained herein may be relied upon as a guarantee, promise, assurance or a representation as to the future.
This material is provided for informational purposes only and does not in any sense constitute a solicitation or offer for the purchase or sale of a specific security or other investment options, nor does it constitute investment advice for any person. The material may contain forward or backward-looking statements regarding intent, beliefs regarding current or past expectations. The views expressed are also subject to change based on market and other conditions. The information presented in this report is based on data obtained from third party sources. Although it is believed to be accurate, no representation or warranty is made as to its accuracy or completeness.
The charts and infographics contained in this blog are typically based on data obtained from third parties and are believed to be accurate. The commentary included is the opinion of the author and subject to change at any time. Any reference to specific securities or investments are for illustrative purposes only and are not intended as investment advice nor are they a recommendation to take any action. Individual securities mentioned may be held in client accounts. Past performance is no guarantee of future results.
As with all investments, there are associated inherent risks including loss of principal. Stock markets, especially foreign markets, are volatile and can decline significantly in response to adverse issuer, political, regulatory, market, or economic developments. Sector and factor investments concentrate in a particular industry or investment attribute, and the investments’ performance could depend heavily on the performance of that industry or attribute and be more volatile than the performance of less concentrated investment options and the market as a whole. Securities of companies with smaller market capitalizations tend to be more volatile and less liquid than larger company stocks. Foreign markets, particularly emerging markets, can be more volatile than U.S. markets due to increased political, regulatory, social or economic uncertainties. Fixed Income investments have exposure to credit, interest rate, market, and inflation risk. Diversification does not ensure a profit or guarantee against a loss.
The Vanguard Total World Stock ETF (VT) seeks to track the FTSE Global All Cap Index, a market-capitalization weighted index representing the performance of large, mid and small cap companies in developed and emerging markets. The Vanguard Total Bond Market ETF (BND) seeks to track the Bloomberg US Aggregate Float Adjusted Index, a broad-based benchmark measuring the investment-grade, U.S. dollar-denominated, fixed-rate taxable bond market; the float-adjusted version excludes U.S. agency debentures, CMBS and MBS passthrough securities held in the Federal Reserve’s SOMA account. The S&P 500® Index measures the performance of 500 large-capitalization U.S. companies and is weighted by market capitalization. The S&P 500 Equal Weight Index is the equal-weight version of the S&P 500, in which each constituent is given the same weight (approximately 0.2%) rather than being weighted by market capitalization, and it is rebalanced quarterly. A cap-weighted index weights each constituent by its market value, so the largest companies have the greatest influence on returns; an equal-weighted index gives each constituent the same weight regardless of size. Real interest rates, or real yields, are bond yields after adjusting for inflation; because Treasury Inflation-Protected Securities (TIPS) are riskless in real terms, their yields are often thought of as real yields, and their principal and coupon payments are adjusted for inflation as measured by the change in the consumer price index (CPI). Beta measures a security’s or portfolio’s sensitivity to movements in the overall market; a beta above 1 indicates greater sensitivity than the market and below 1 indicates less. High-beta (riskier) stocks are those with greater sensitivity to market movements, and lower-risk stocks are those with less. Correlation measures the degree to which two investments move in relation to each other, ranging from +1 (moving in the same direction) to -1 (moving in opposite directions). Volatility is the degree of variation in an investment’s returns over time, commonly measured by standard deviation. Drawdown is the decline in value from a peak to a subsequent trough, expressed as a percentage. Past performance is no guarantee of future results, and indices are unmanaged and cannot be invested in directly.
Please contact your AIM Regional Consultant for more information or to address any questions that you may have.
Algorithmic Investment Models LLC (AIM)
125 Newbury St., 4th Floor, Boston, MA 02116 (844-401-7699)