

Is the Strait of Hormuz open? Oil inventories aren’t infinite. Tokens keep getting cheaper, but there’s a shortage of compute. Is anyone besides venture capitalists actually paying for AI? The capital needs of the data center buildout are stressing markets, and investors are getting skittish. Buy the dip! El Niño.
1. No:
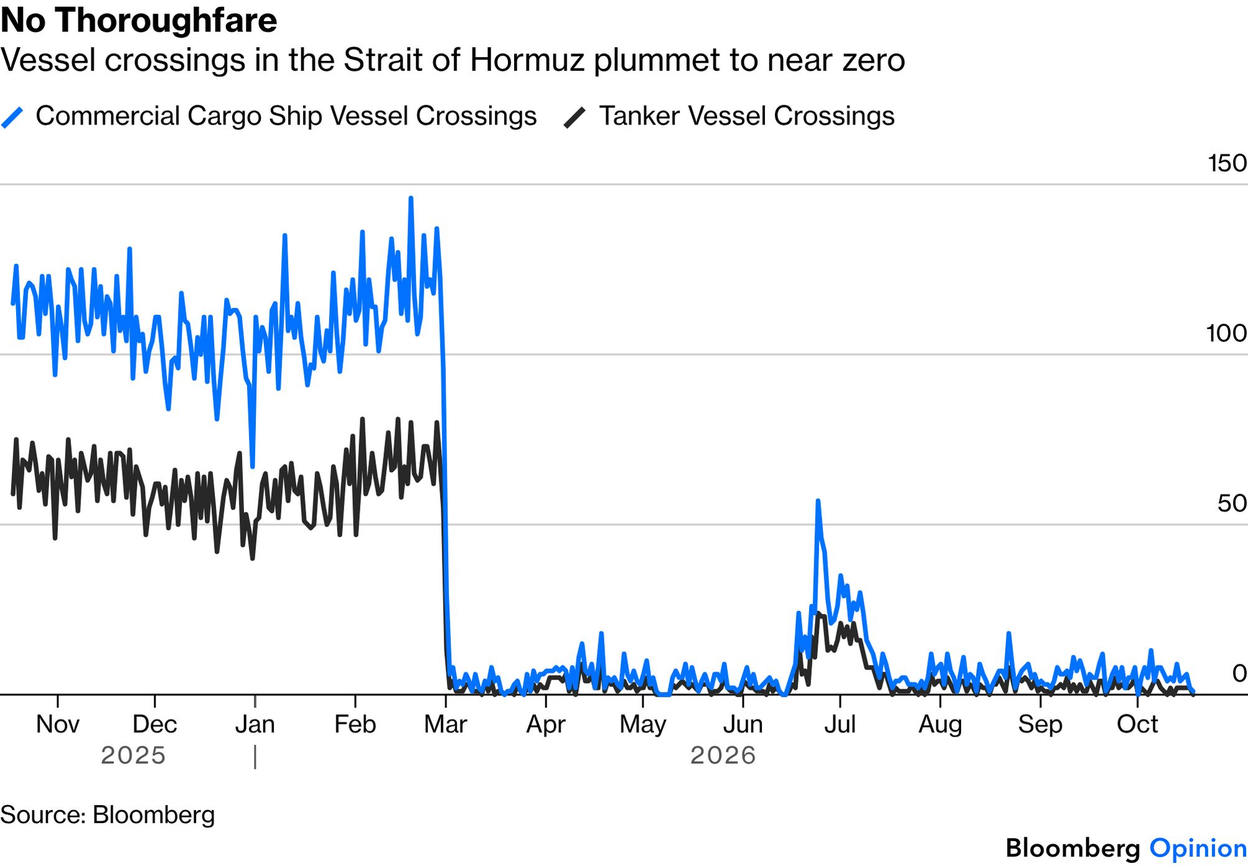 Source: John Authers, Points of Return on 10/19/2026
2. Some oil is still getting out, but it’s difficult and extremely expensive:
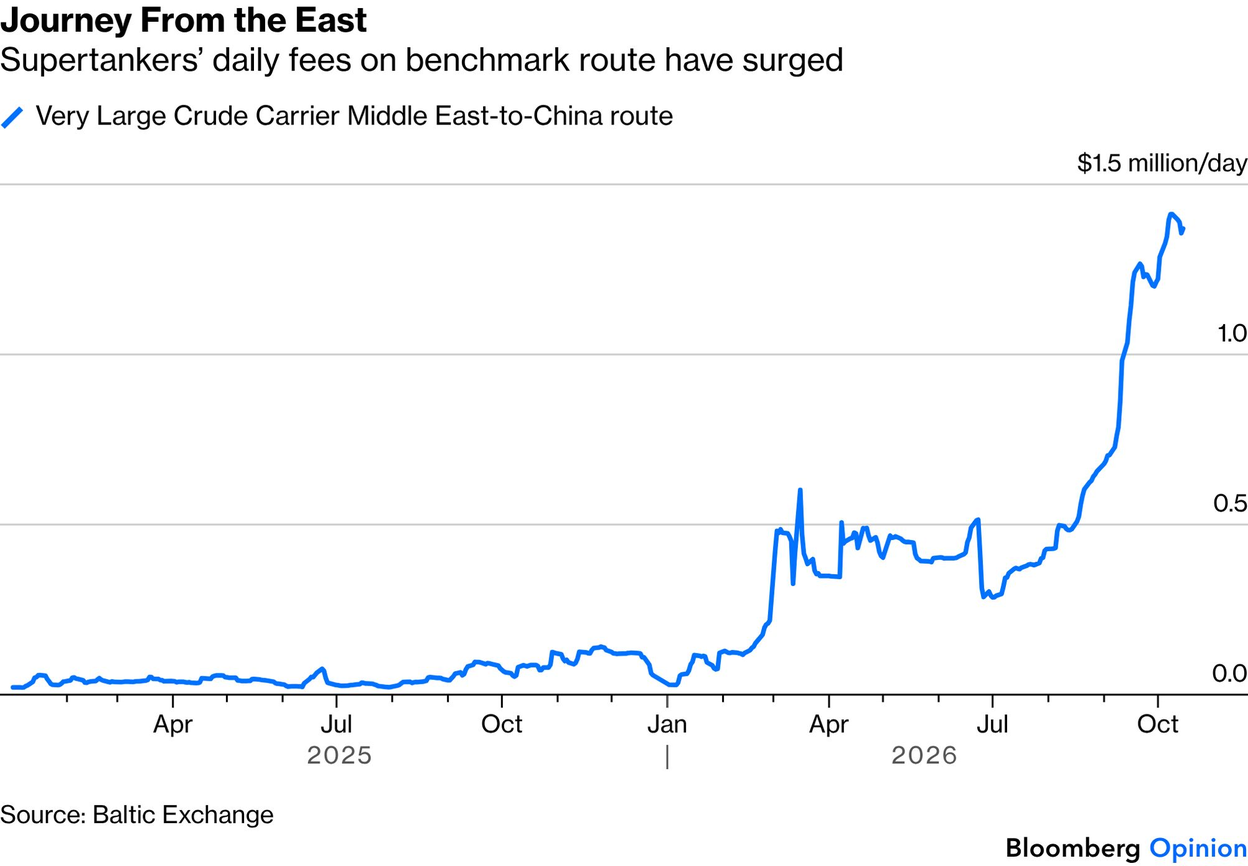 Source: John Authers, Points of Return on 10/19/2026
3. Global oil inventories are being depleted at a record pace:
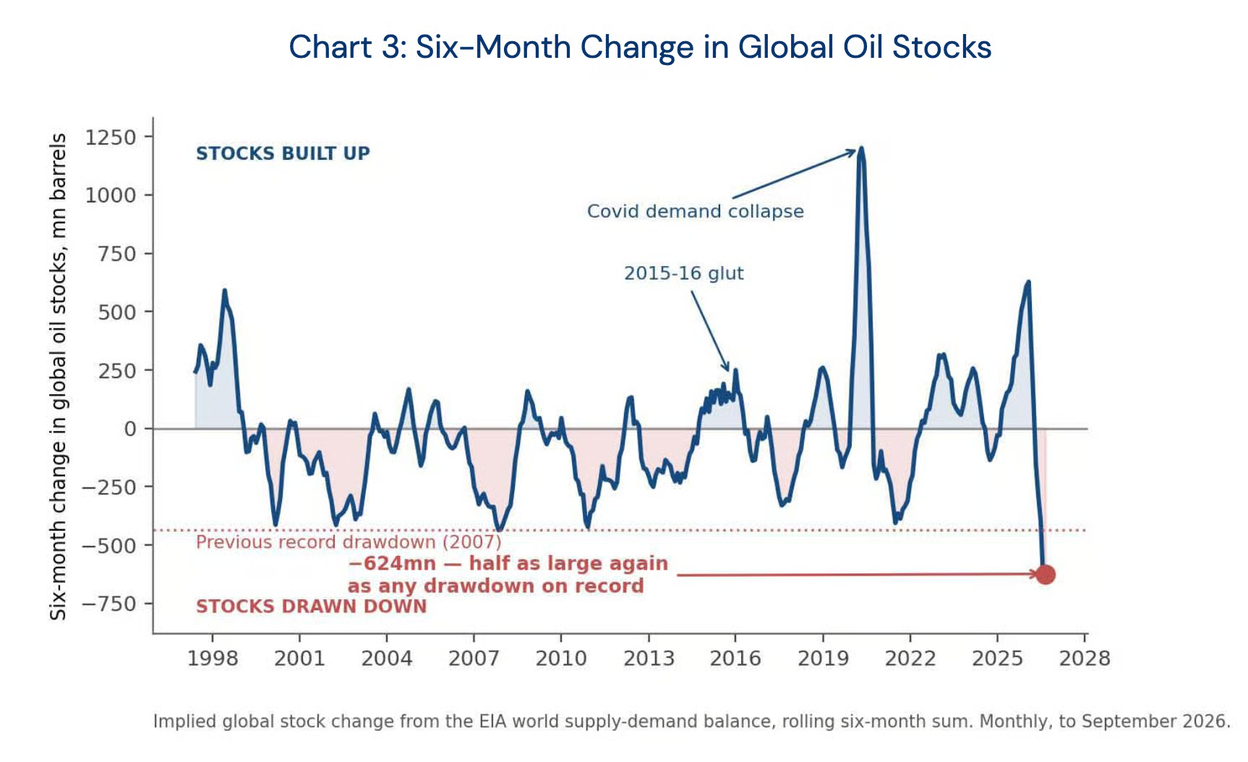 Source: Andrew Cates, Haver Analytics via the Daily Chartbook on 9/25/2026
4. Compute prices have bucked the trend in token prices:
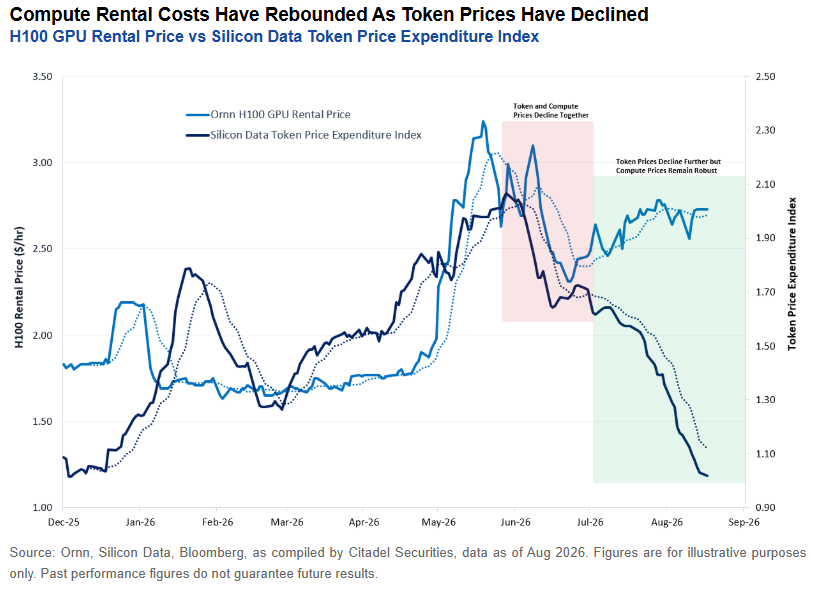 Source: Citadel Securities
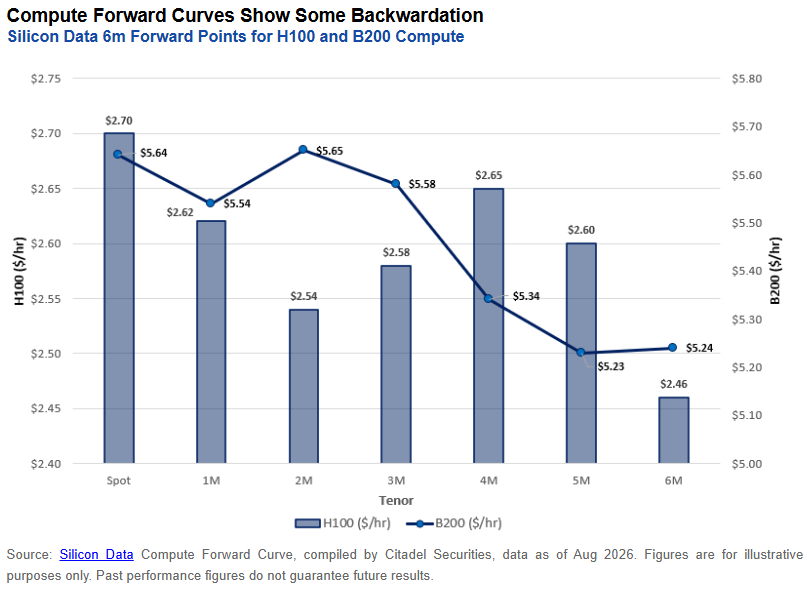
5. Buyers are paying up for compute amid the current shortage. The pricing curve rewards anyone who can bring compute to market now:
 Source: Citadel Securities
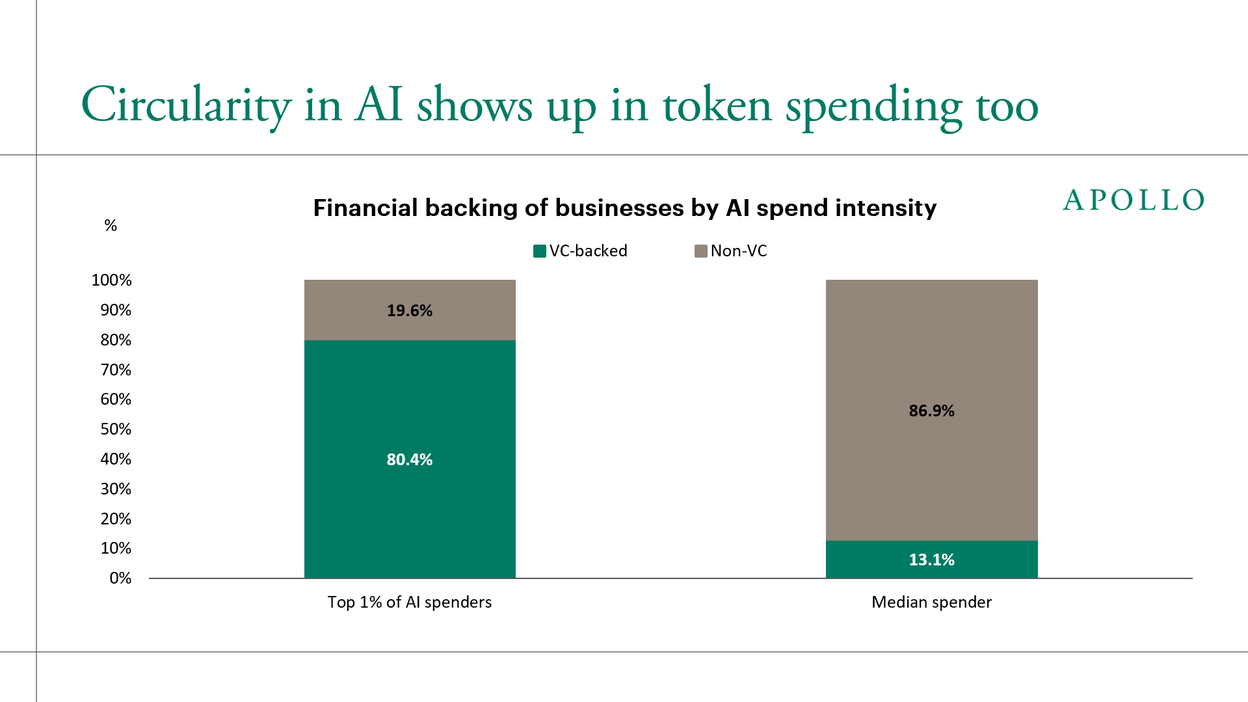
6. Four in five of the heaviest AI spenders are VC-backed:
 Source:
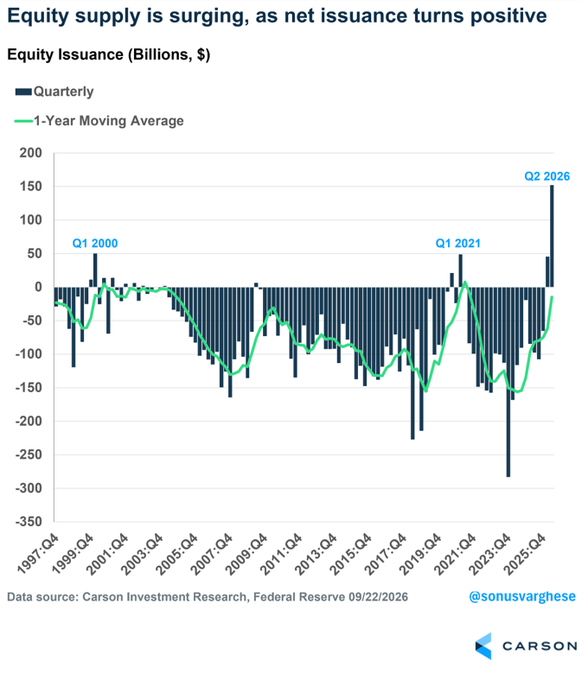
7. Building AI takes a lot of capital:
 Source: @RyanDetrick
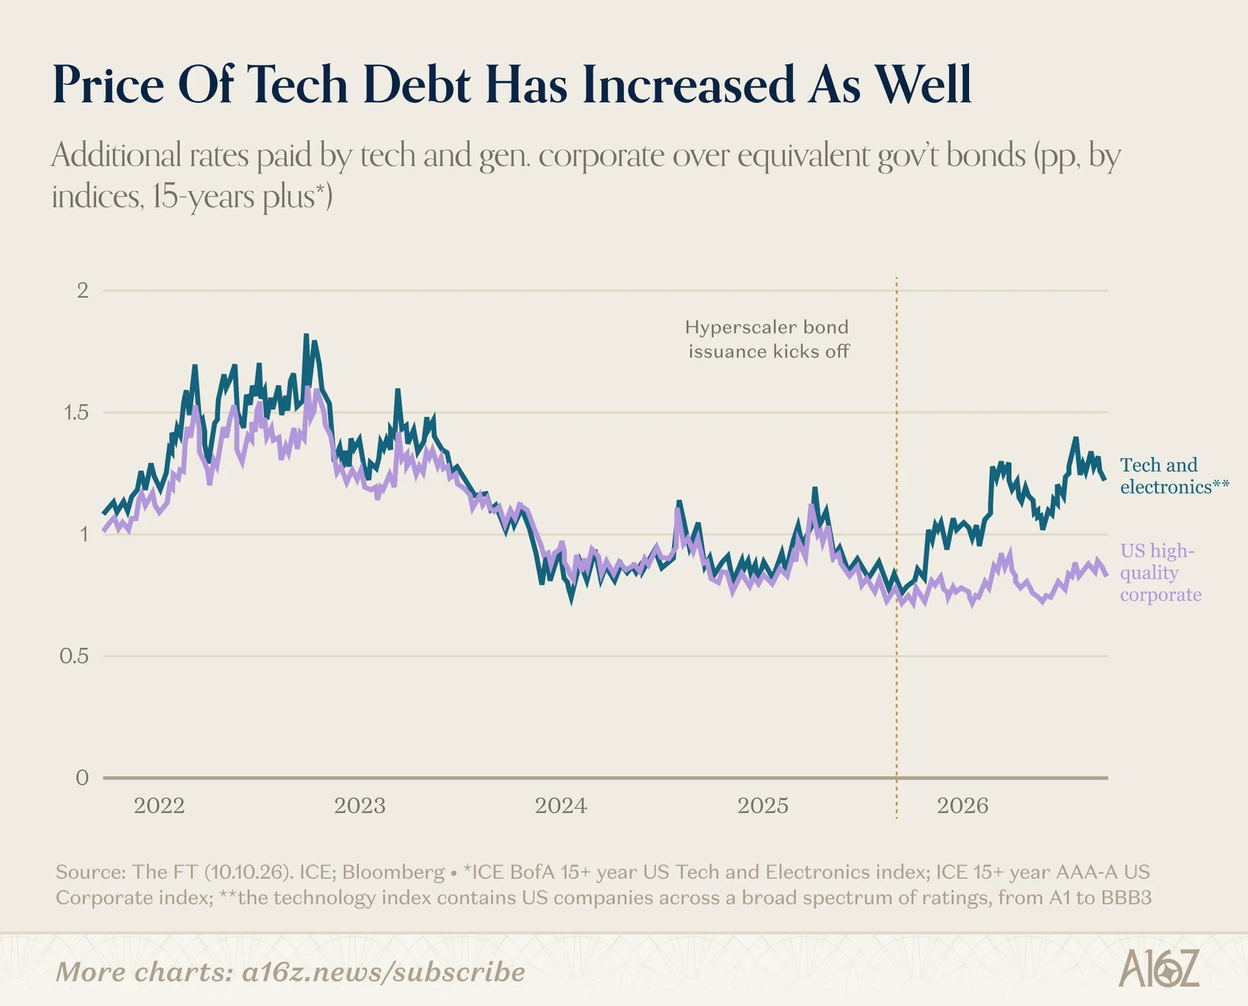
8. Tech companies now pay more to borrow than other high-quality companies:
 Source: Moses Sternstein, a16z via the Daily Chartbook on 10/16/2026
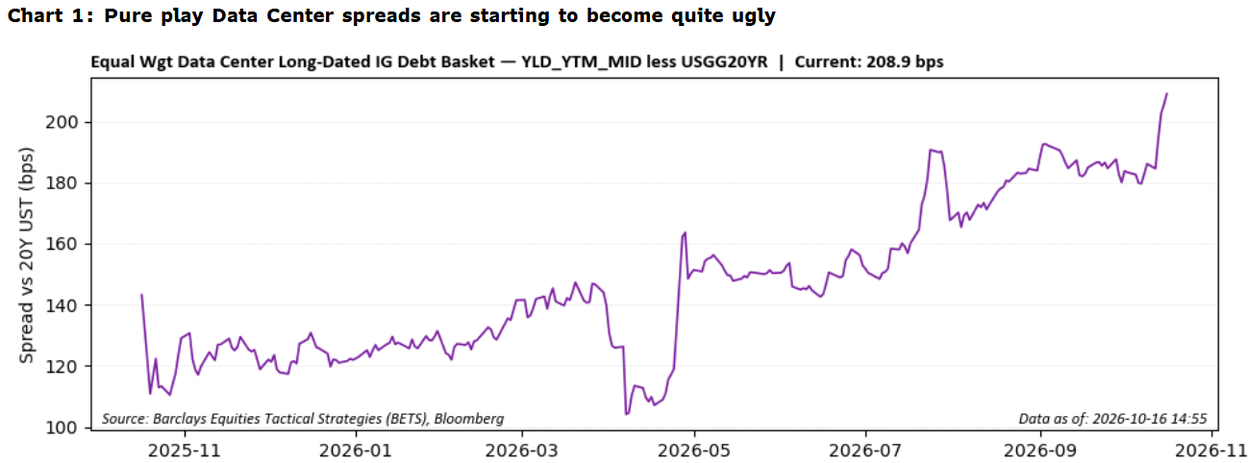
9. Investors are demanding higher returns to fund data centers:
 Source: Alexander Altmann, Barclays Equity Technical Strategies via John Authers, Points of Return on 10/19/2026
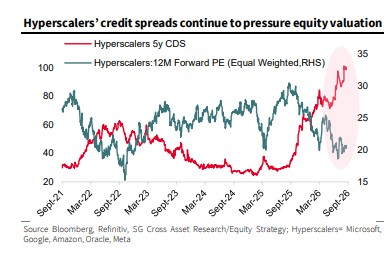
10. Historically capital-light tech companies are levering up to fund a capex boom, and investors aren’t giving them a pass:
 Source: John Authers, Points of Return on 10/22/2026
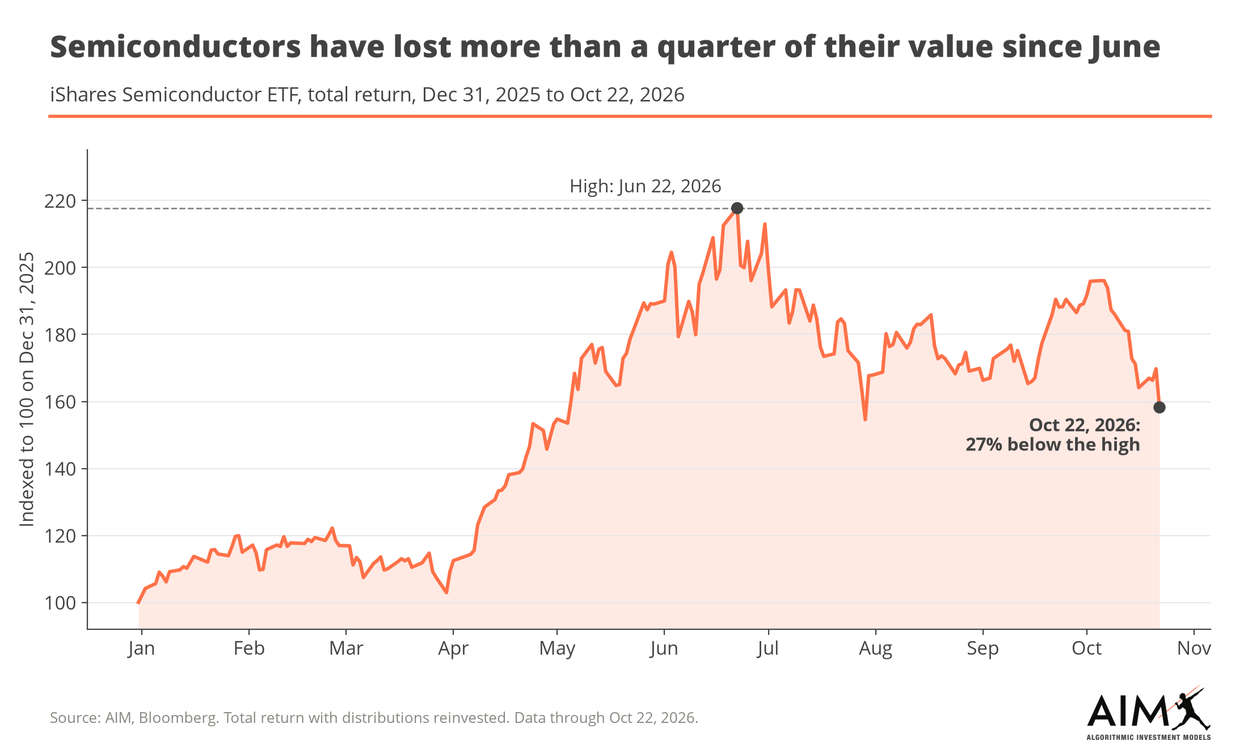
11. Semiconductors are under pressure:
 Source: AIM
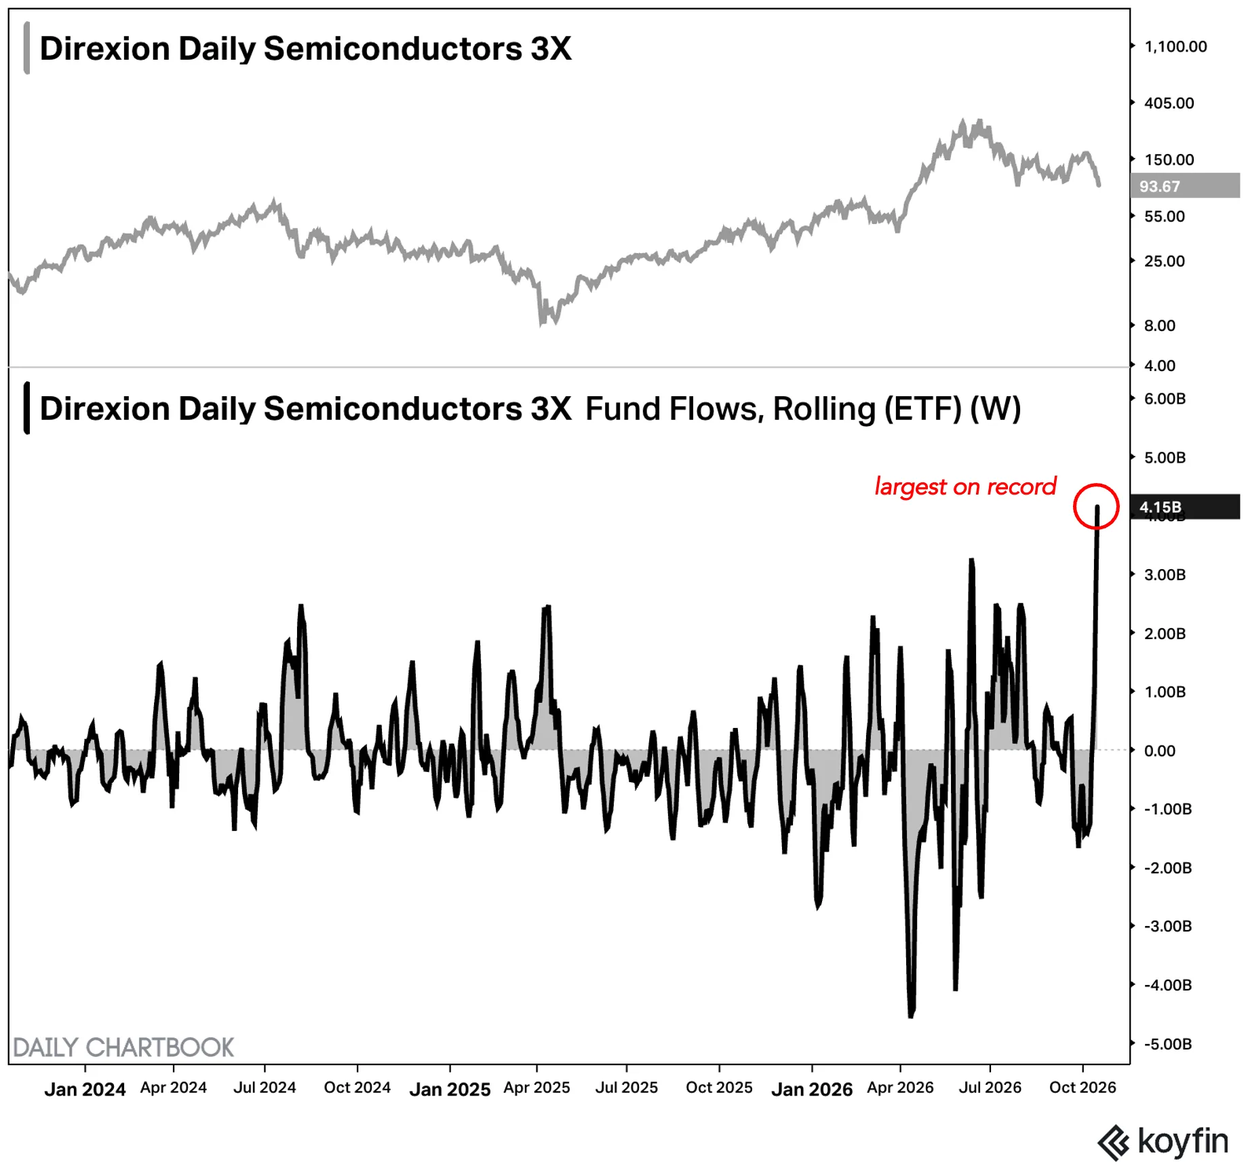
12. Buying the dip has worked for so long that investors are tripling down:
 Source: Koyfin via the Daily Chartbook on 10/16/2026
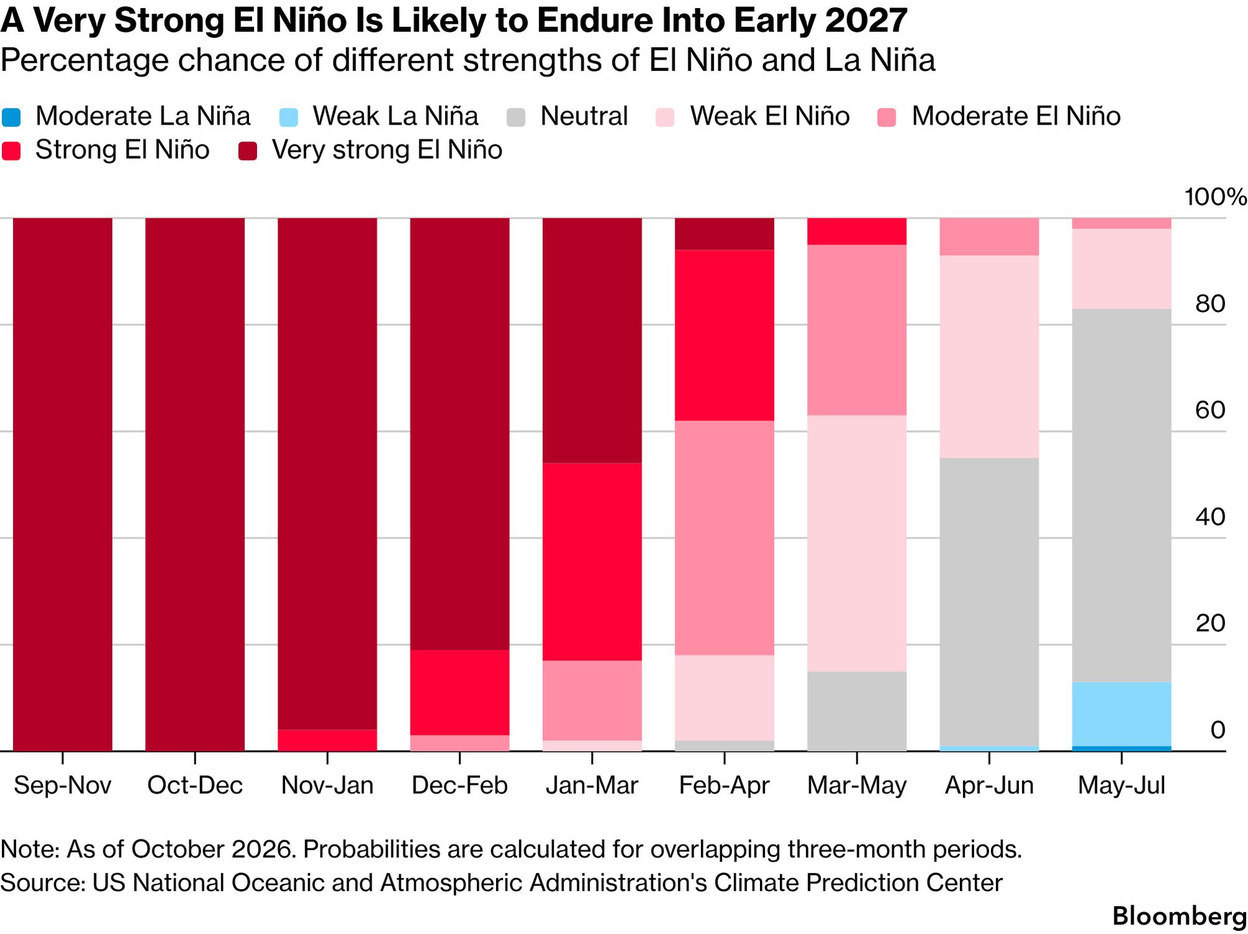
13. A very strong El Niño is likely to last into early 2027:
 Source: Bloomberg Markets Daily
Disclosures:
Copyright © 2026 Algorithmic Investment Models LLC (AIM). All rights reserved. All materials appearing in this commentary are protected by copyright as a collective work or compilation under U.S. copyright laws and are the property of Algorithmic Investment Models. You may not copy, reproduce, publish, use, create derivative works, transmit, sell or in any way exploit any content, in whole or in part, in this commentary without express permission from Algorithmic Investment Models.
Certain information contained herein constitutes “forward-looking statements,” which can be identified by the use of forward-looking terminology such as “may,” “will,” “should,” “expect,” “anticipate,” “project,” “estimate,” “intend,” “continue,” or “believe,” or the negatives thereof or other variations thereon or comparable terminology. Due to various risks and uncertainties, actual events, results or actual performance may differ materially from those reflected or contemplated in such forward-looking statements. Nothing contained herein may be relied upon as a guarantee, promise, assurance or a representation as to the future.
This material is provided for informational purposes only and does not in any sense constitute a solicitation or offer for the purchase or sale of a specific security or other investment options, nor does it constitute investment advice for any person. The material may contain forward or backward-looking statements regarding intent, beliefs regarding current or past expectations. The views expressed are also subject to change based on market and other conditions. The information presented in this report is based on data obtained from third party sources. Although it is believed to be accurate, no representation or warranty is made as to its accuracy or completeness.
The charts and infographics contained in this blog are typically based on data obtained from third parties and are believed to be accurate. The commentary included is the opinion of the author and subject to change at any time. Any reference to specific securities or investments are for illustrative purposes only and are not intended as investment advice nor are they a recommendation to take any action. Individual securities mentioned may be held in client accounts. Past performance is no guarantee of future results.
As with all investments, there are associated inherent risks including loss of principal. Stock markets, especially foreign markets, are volatile and can decline significantly in response to adverse issuer, political, regulatory, market, or economic developments. Sector and factor investments concentrate in a particular industry or investment attribute, and the investments’ performance could depend heavily on the performance of that industry or attribute and be more volatile than the performance of less concentrated investment options and the market as a whole. Securities of companies with smaller market capitalizations tend to be more volatile and less liquid than larger company stocks. Foreign markets, particularly emerging markets, can be more volatile than U.S. markets due to increased political, regulatory, social or economic uncertainties. Fixed Income investments have exposure to credit, interest rate, market, and inflation risk. Diversification does not ensure a profit or guarantee against a loss.
The Ornn Compute Price Index measures the hourly price to rent graphics processing units used for artificial intelligence computing, based on spot market transactions. The Silicon Data LLM Token Expenditure Index measures the usage-weighted average price paid per million tokens processed by large language models. The ICE BofA 15+ Year US Tech and Electronics Index measures the performance of U.S. dollar-denominated investment-grade corporate bonds issued by technology and electronics companies with remaining maturities of 15 years or more. The ICE BofA 15+ Year AAA-A US Corporate Index measures the performance of U.S. dollar-denominated corporate bonds rated AAA through A with remaining maturities of 15 years or more. The 20-Year Treasury Yield represents the interest rate on U.S. government debt securities with a maturity of twenty years. A credit default swap (CDS) is a contract that compensates the buyer if a borrower defaults. Its spread, the annual cost of that protection, is a market measure of default risk. The NYSE Semiconductor Index measures the performance of the 30 largest U.S.-listed companies in the semiconductor industry. A moving average is a statistical measure that smooths price data by calculating the average value over a specified period. A credit spread is the difference in yield between a corporate bond and a government bond of similar maturity, reflecting the additional compensation investors require for credit risk. The price-to-earnings ratio compares a company’s or index’s share price with its earnings per share.
Please contact your AIM Regional Consultant for more information or to address any questions that you may have.
Algorithmic Investment Models LLC (AIM), 125 Newbury St. 4th Floor, Boston, MA 02116 (844-401-7699)