

The market is weird. The average stock has fallen seven weeks in a row. Stocks have rarely moved less with each other, or more with bonds. Whole sectors look like they have no market exposure at all. The economy looks strong on paper but doesn’t feel that way to consumers. Households are squeezed, and the one part that’s booming feels like a threat. Is it good if the price of your product keeps falling?
1. The equal-weight S&P 500 has fallen seven weeks in a row, tying its 2022 record, and is near an all-time low relative to the cap-weighted index:
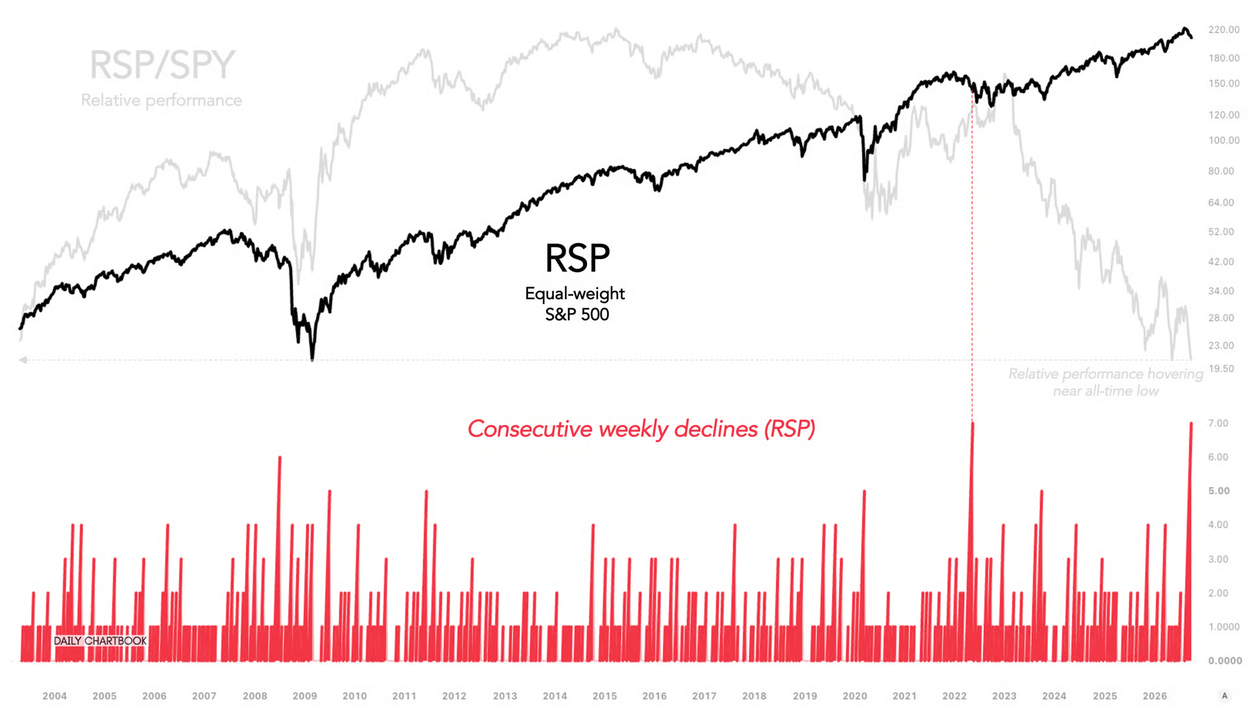 Source: The Daily Chartbook on 9/30/2026
2. Since at least 2011, stocks have never moved less with each other, or more with long-term Treasuries:
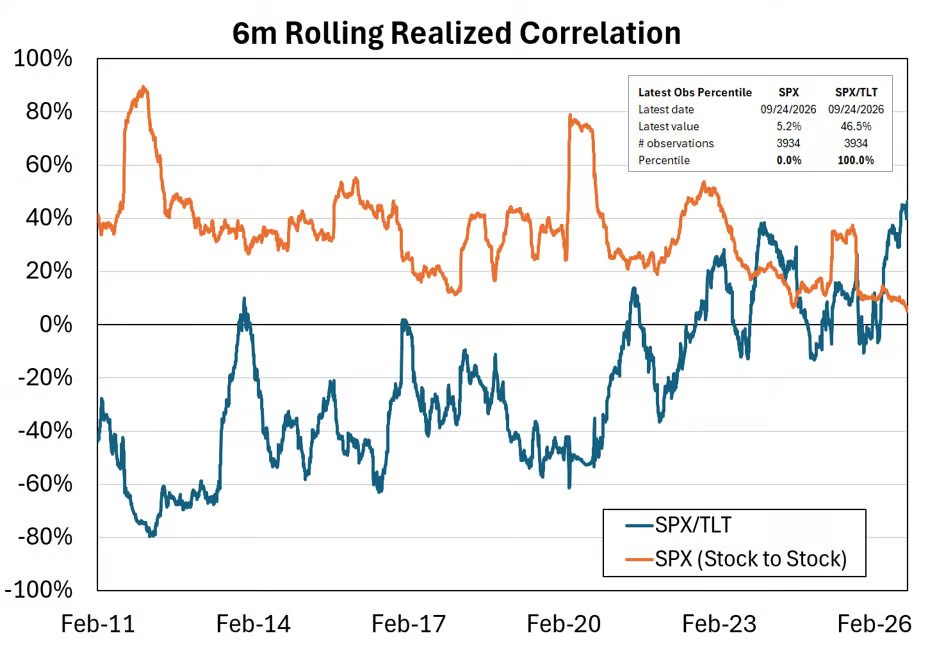 Source: @alpha_ex_llc
3. Energy, low volatility and healthcare stocks now move inversely to the S&P 500, as if they had no market exposure at all:
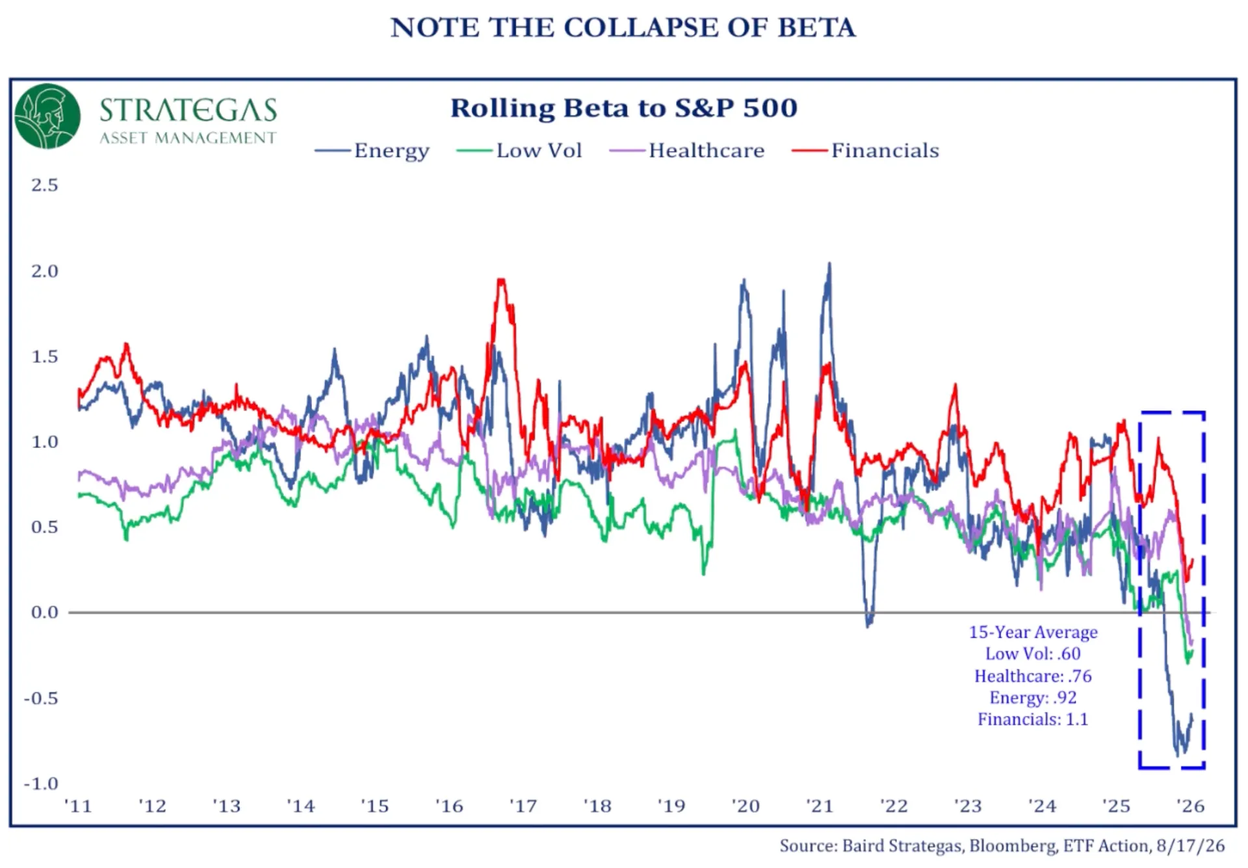 Source: Todd Sohn, Strategas via the Daily Chartbook on 8/19/2026
4. No one wants defensive stocks. Consumer staples and utilities are at multi-year lows relative to the S&P 500:
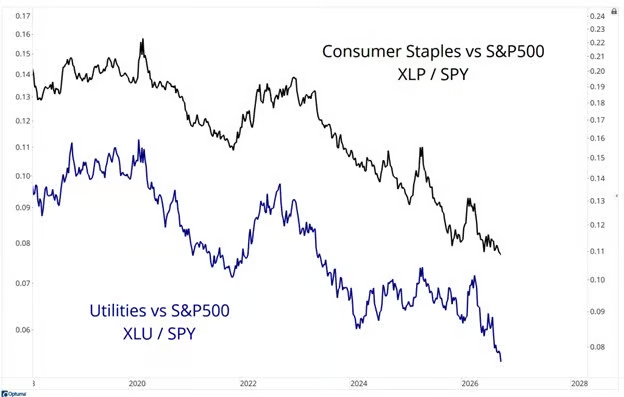 Source: JC Parets, TrendLabs via the Daily Chartbook on 9/26/2026
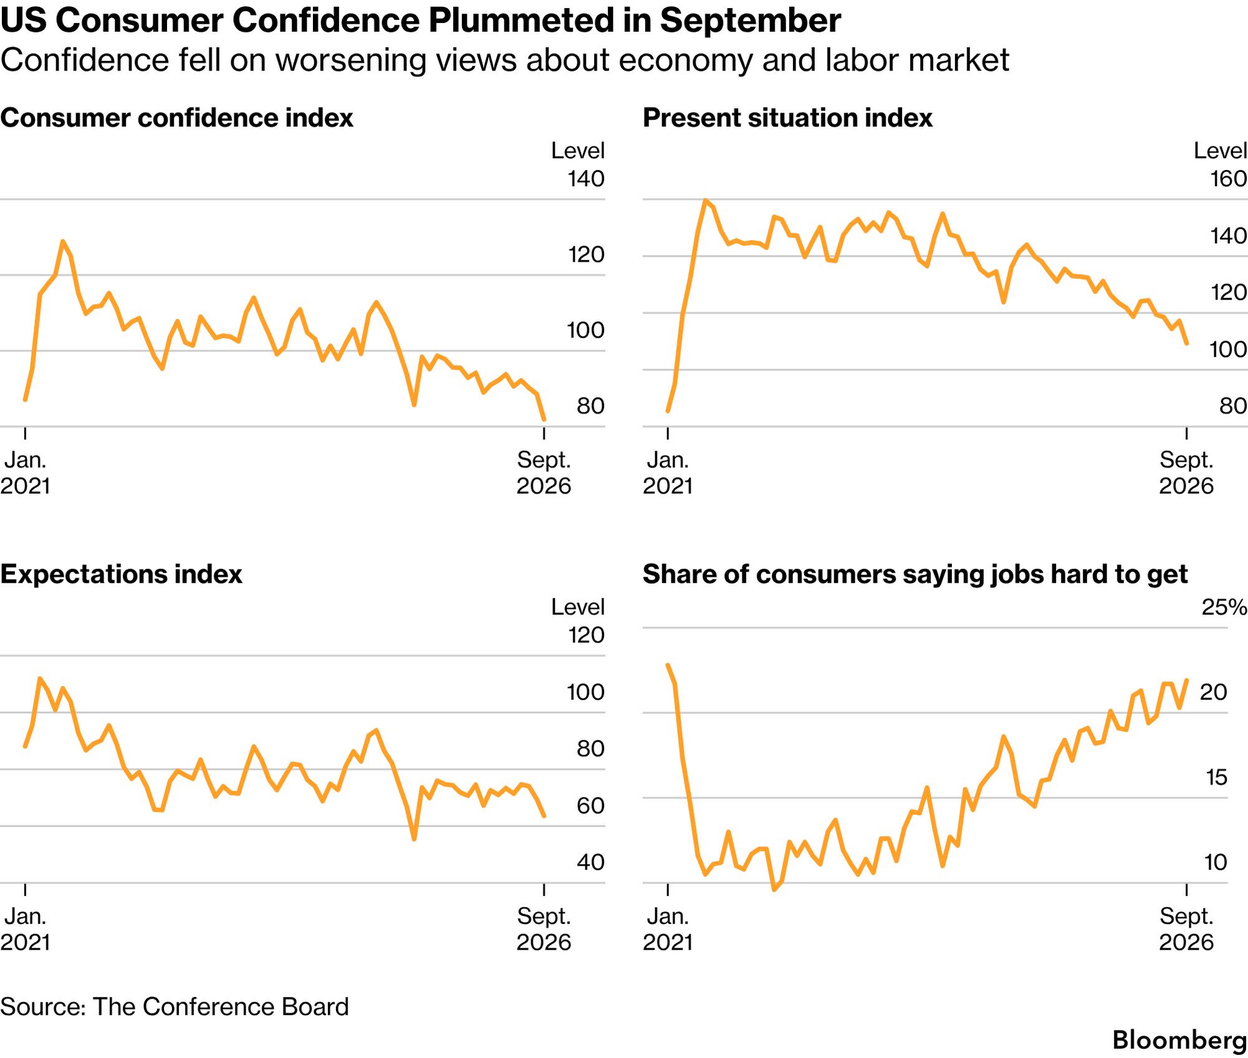
5. Consumer confidence fell in September to its lowest level in at least five years, while the share of consumers saying jobs are hard to get topped 20%:
 Source: Bloomberg Evening Briefing
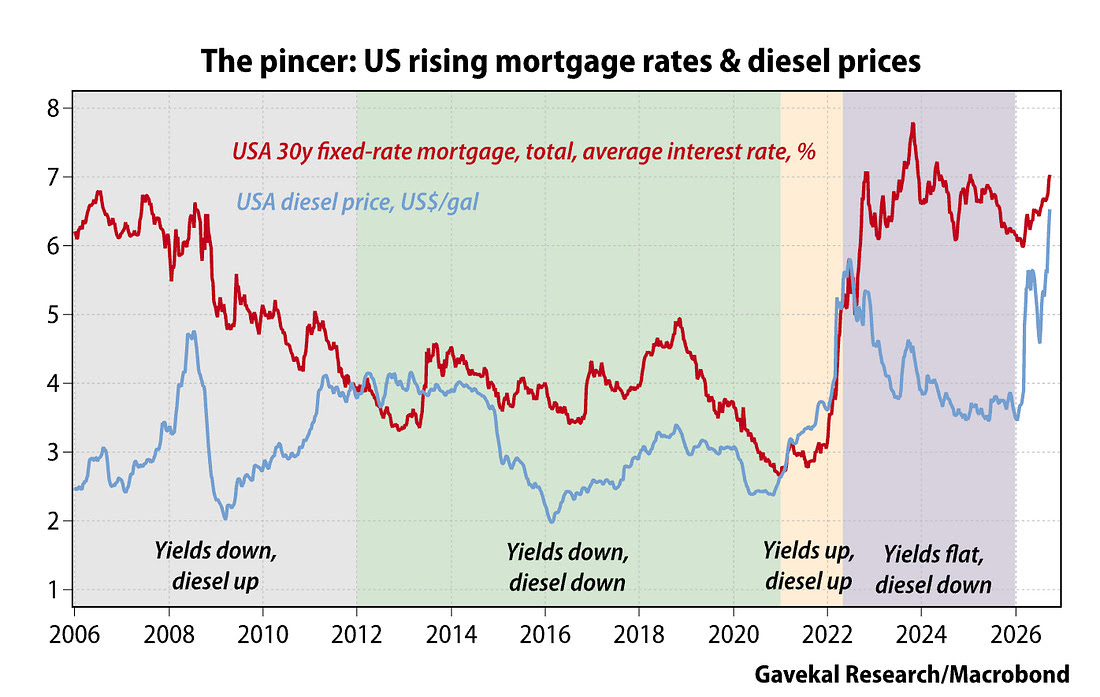
6. Mortgage rates and diesel prices are rising at the same time, the misery index for our time:
 Source:
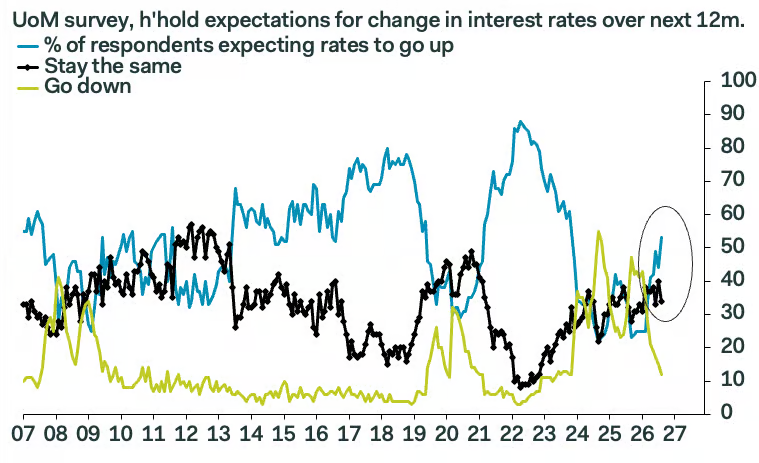
7. Households no longer expect rates to fall, which may change how they approach big purchases:
 Source: @samueltombs via the Daily Chartbook on 8/14/2026
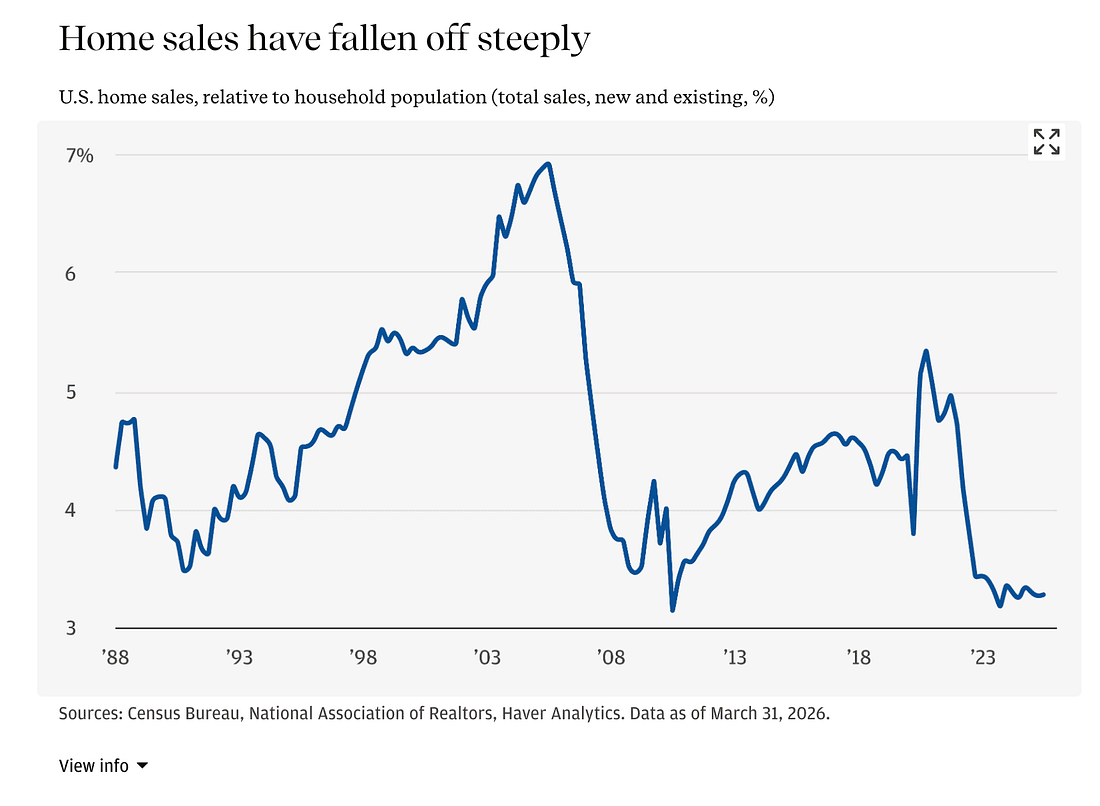
8. Relative to the number of households, home sales are near levels last seen following the 2008 housing crisis:
 Source:
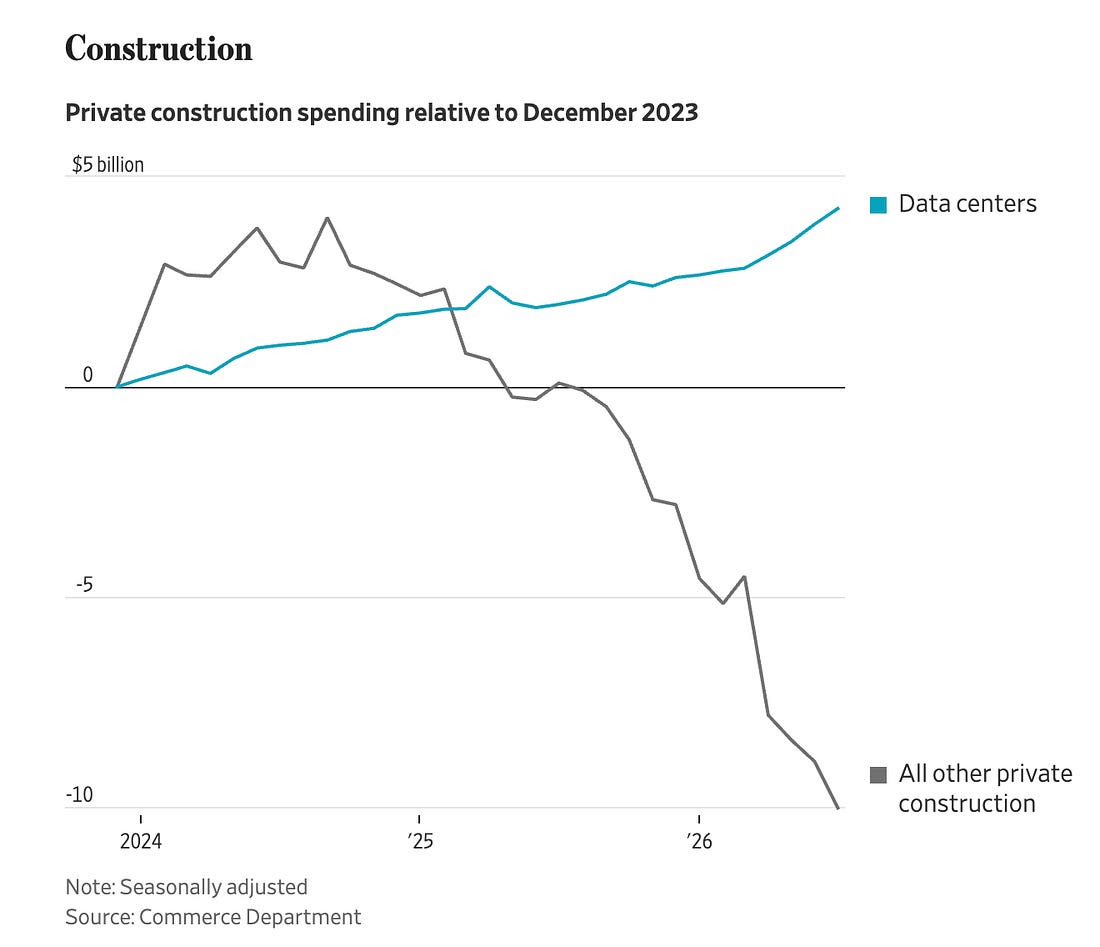
9. Data centers really are the only game in town:
 Source: Chartbook a newsletter from Adam Tooze
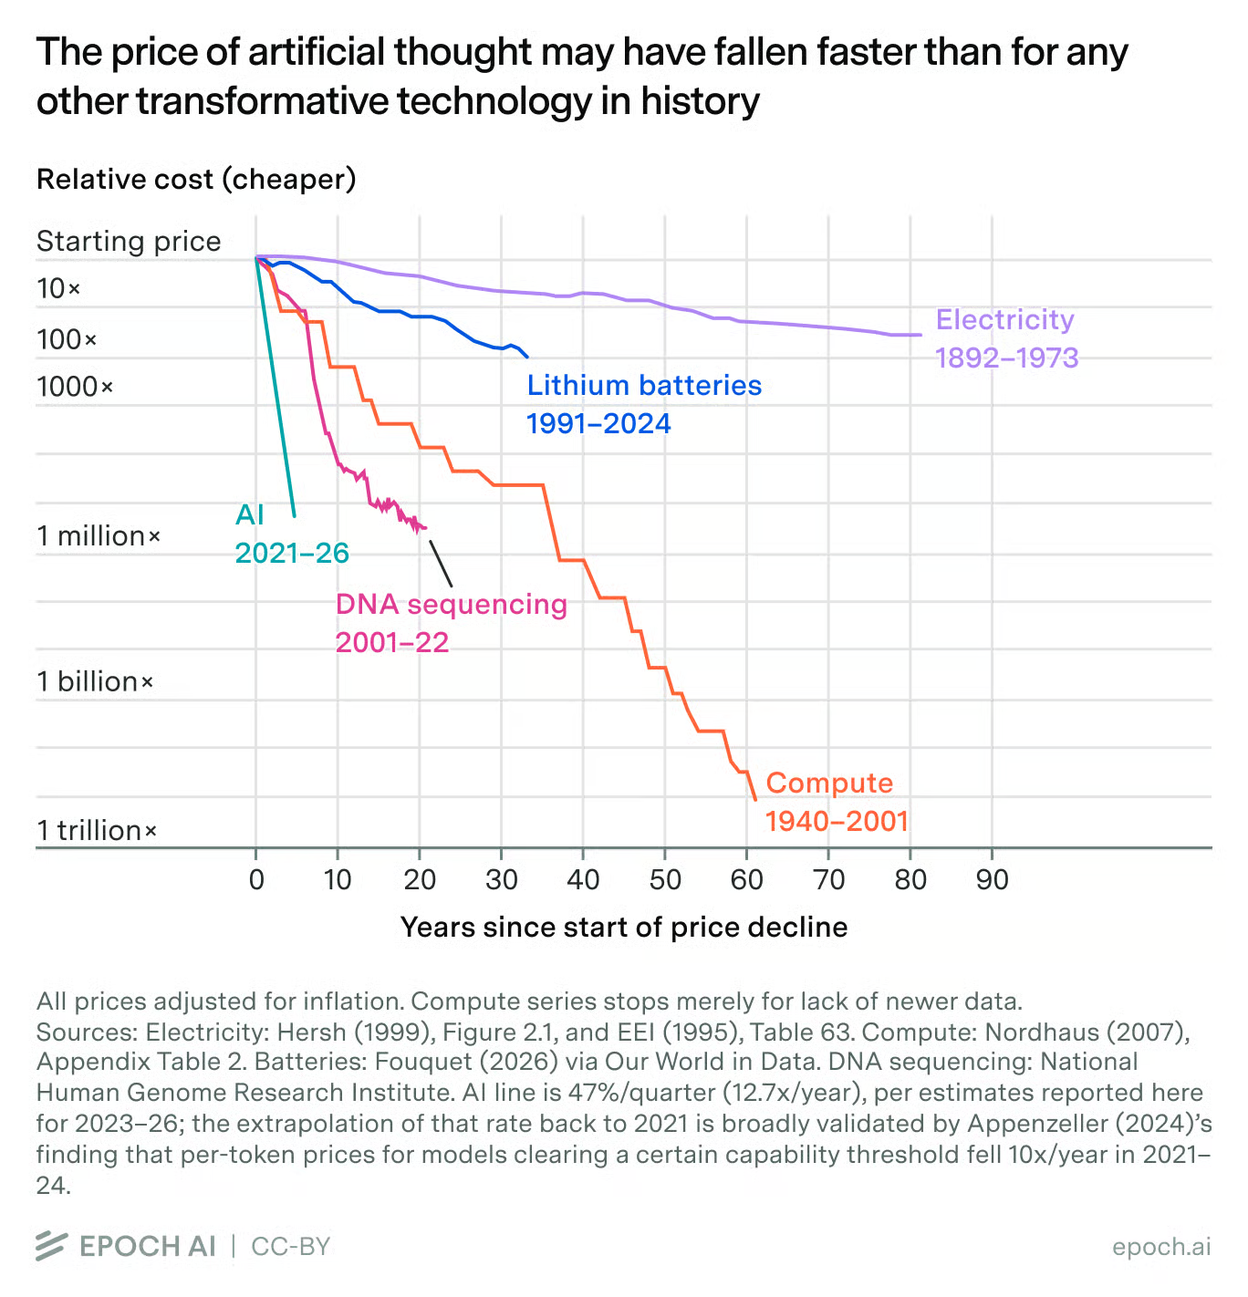
10. In about five years, the cost of AI has fallen nearly a million-fold:
 Source: Epoch AI via the Daily Chartbook on 9/23/2026
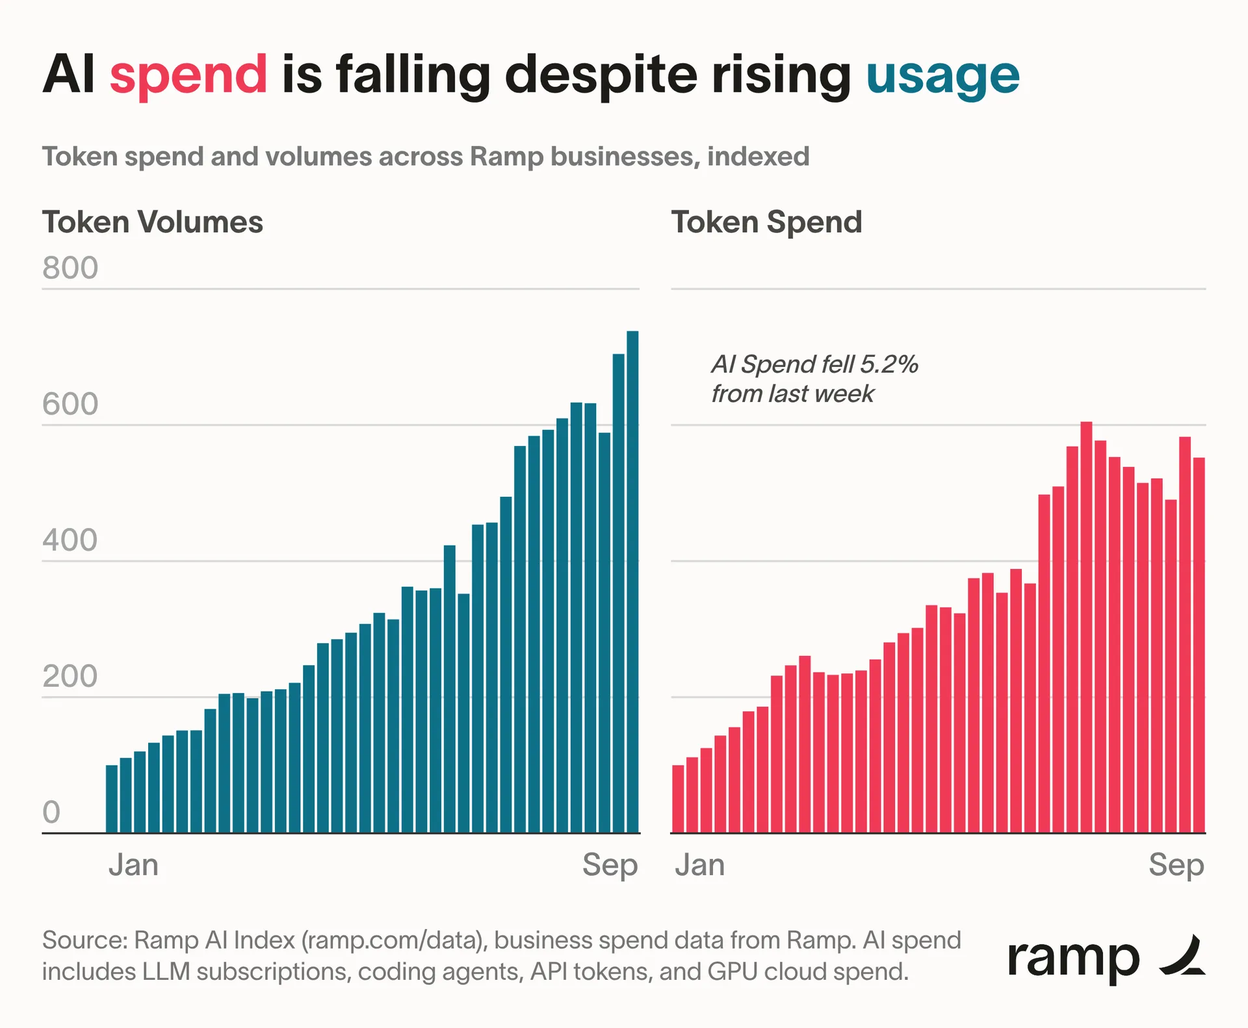
11. Is it a good business if customers are paying less to use more of your product?
 Source: @arakharazian via the Daily Chartbook on 10/1/2026
Disclosures:
Copyright © 2026 Algorithmic Investment Models LLC (AIM). All rights reserved. All materials appearing in this commentary are protected by copyright as a collective work or compilation under U.S. copyright laws and are the property of Algorithmic Investment Models. You may not copy, reproduce, publish, use, create derivative works, transmit, sell or in any way exploit any content, in whole or in part, in this commentary without express permission from Algorithmic Investment Models.
Certain information contained herein constitutes “forward-looking statements,” which can be identified by the use of forward-looking terminology such as “may,” “will,” “should,” “expect,” “anticipate,” “project,” “estimate,” “intend,” “continue,” or “believe,” or the negatives thereof or other variations thereon or comparable terminology. Due to various risks and uncertainties, actual events, results or actual performance may differ materially from those reflected or contemplated in such forward-looking statements. Nothing contained herein may be relied upon as a guarantee, promise, assurance or a representation as to the future.
This material is provided for informational purposes only and does not in any sense constitute a solicitation or offer for the purchase or sale of a specific security or other investment options, nor does it constitute investment advice for any person. The material may contain forward or backward-looking statements regarding intent, beliefs regarding current or past expectations. The views expressed are also subject to change based on market and other conditions. The information presented in this report is based on data obtained from third party sources. Although it is believed to be accurate, no representation or warranty is made as to its accuracy or completeness.
The charts and infographics contained in this blog are typically based on data obtained from third parties and are believed to be accurate. The commentary included is the opinion of the author and subject to change at any time. Any reference to specific securities or investments are for illustrative purposes only and are not intended as investment advice nor are they a recommendation to take any action. Individual securities mentioned may be held in client accounts. Past performance is no guarantee of future results.
As with all investments, there are associated inherent risks including loss of principal. Stock markets, especially foreign markets, are volatile and can decline significantly in response to adverse issuer, political, regulatory, market, or economic developments. Sector and factor investments concentrate in a particular industry or investment attribute, and the investments’ performance could depend heavily on the performance of that industry or attribute and be more volatile than the performance of less concentrated investment options and the market as a whole. Securities of companies with smaller market capitalizations tend to be more volatile and less liquid than larger company stocks. Foreign markets, particularly emerging markets, can be more volatile than U.S. markets due to increased political, regulatory, social or economic uncertainties. Fixed Income investments have exposure to credit, interest rate, market, and inflation risk. Diversification does not ensure a profit or guarantee against a loss.
The S&P 500 Index measures the performance of 500 large-capitalization U.S. companies. The S&P 500 Equal Weight Index equally weights the constituents of the S&P 500 Index. The Conference Board Consumer Confidence Index is a monthly survey-based measure of U.S. consumers’ assessment of current business and labor market conditions and their expectations for the next six months; its Present Situation Index reflects views of current conditions and its Expectations Index reflects the six-month outlook. Inflation is the rate at which the general level of prices for goods and services rises over time, resulting in a decline in purchasing power.
Please contact your AIM Regional Consultant for more information or to address any questions that you may have.
Algorithmic Investment Models LLC (AIM), 125 Newbury St. 4th Floor, Boston, MA 02116 (844-401-7699)