

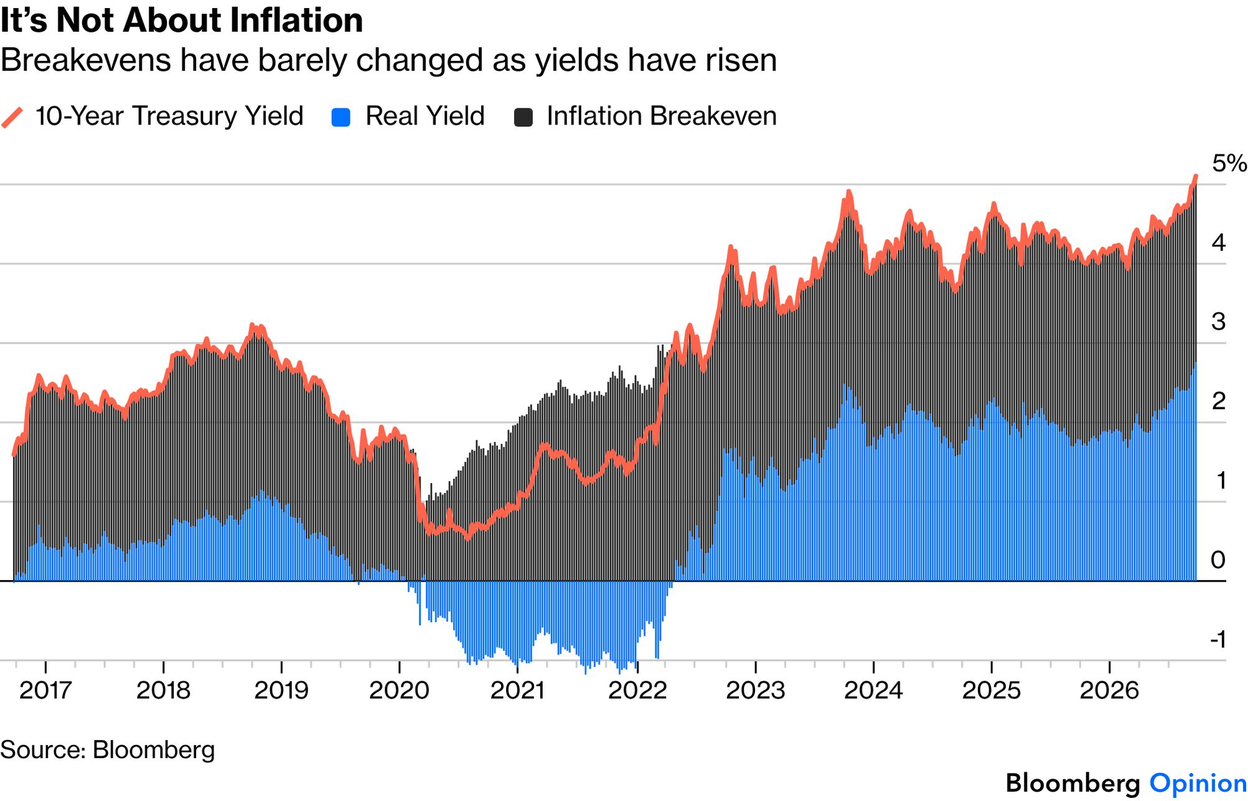
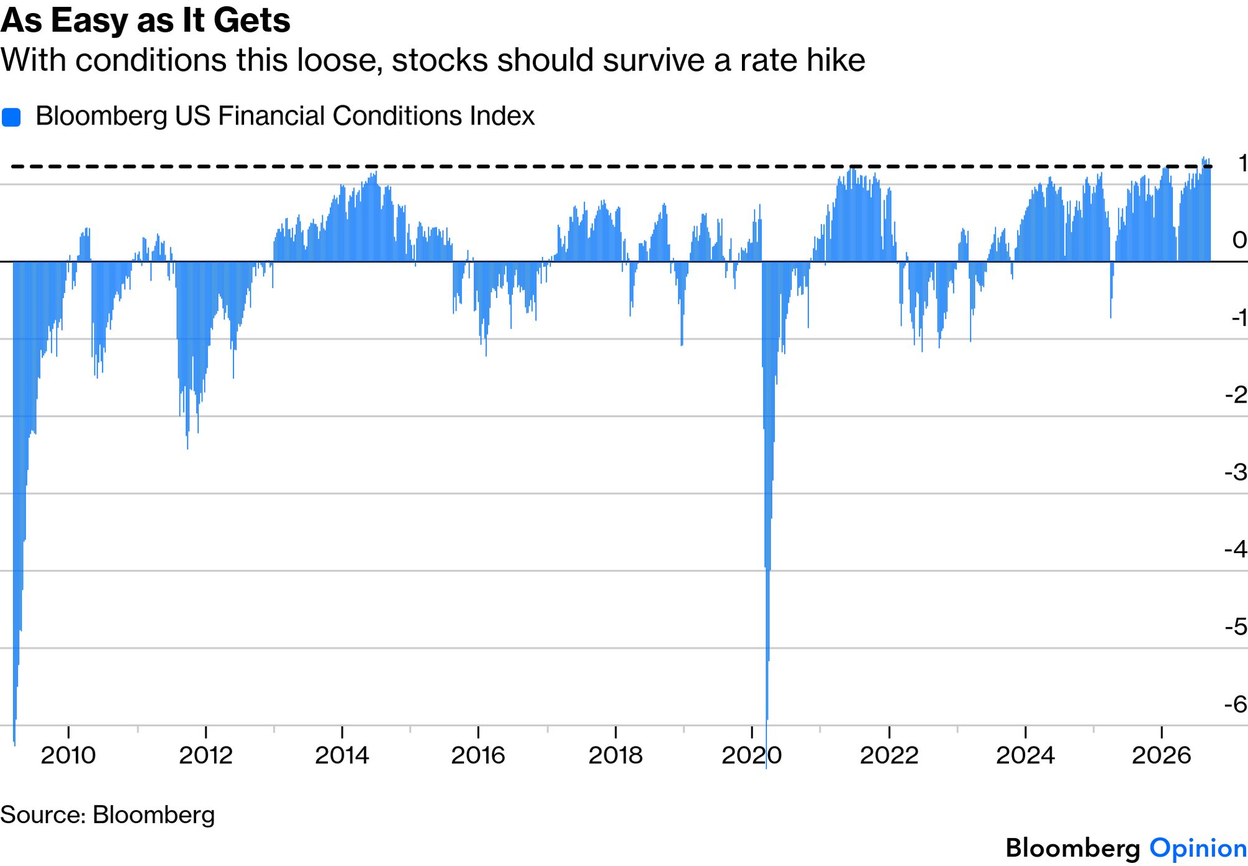
The U.S. economy appears to be re-accelerating. The 10-year Treasury yield is closing in on 5%, but this time the move isn’t about inflation. Real yields are doing the heavy lifting. Surprisingly, financial conditions are looser than at any point since 2009, which may give equities some cushion if the Federal Reserve’s next move is a hike. The AI buildout is shaping up to be the largest capex boom on record, but can valuations tell us whether it’s a bubble? Where are we going to find all this copper?
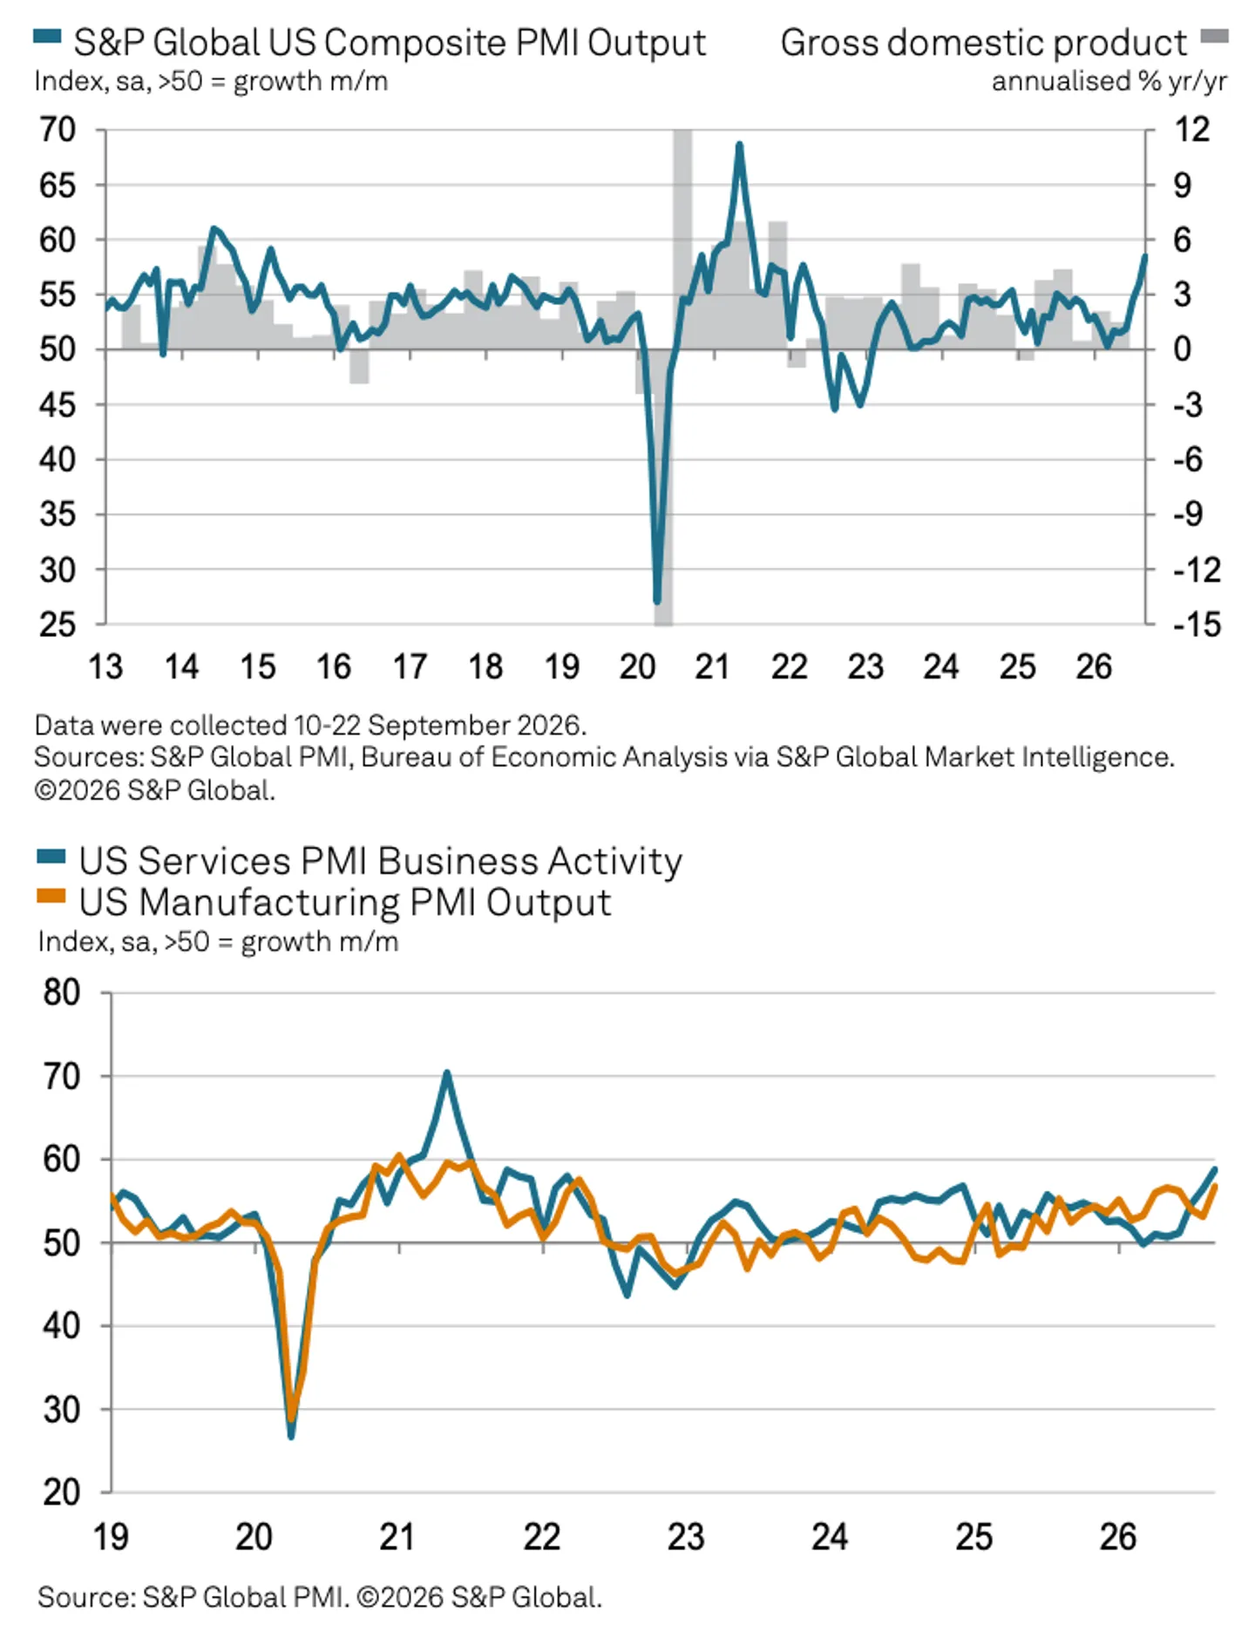
1. Business activity is expanding at its fastest pace in years, with services and manufacturing both well into growth territory:
 Source: Chris Williamson, S&P Global via the Daily Chartbook on 9/23/2026
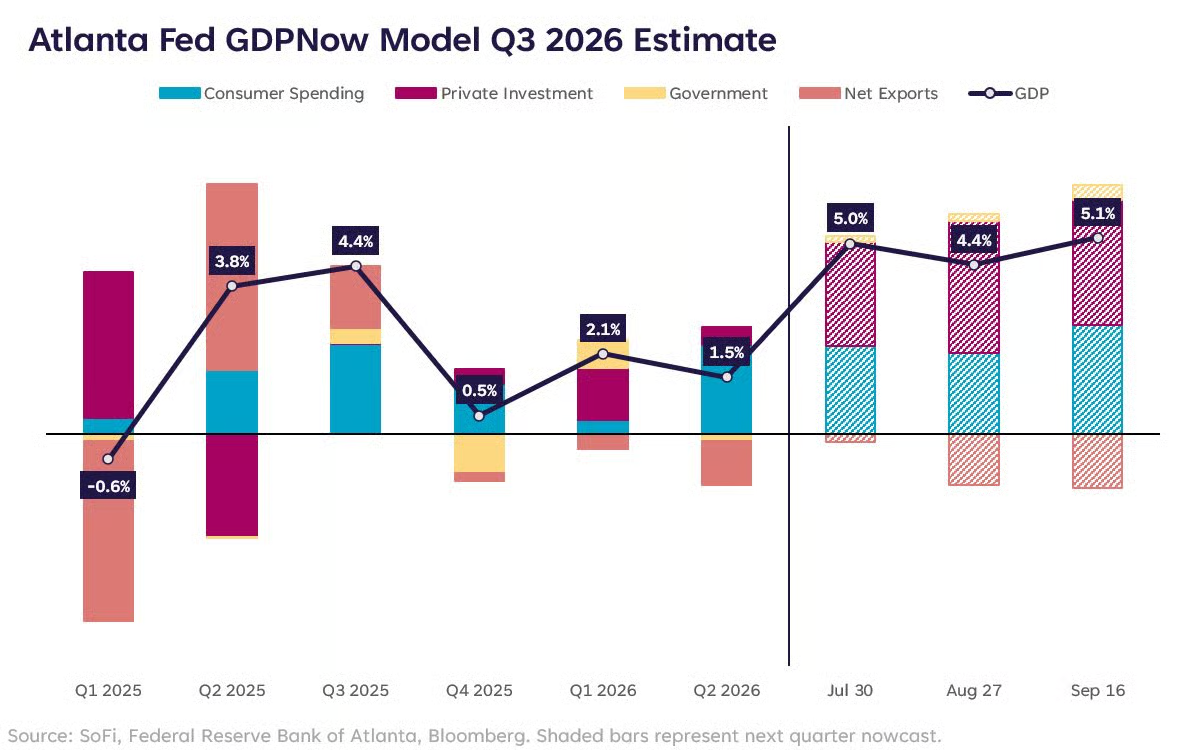
2. The Atlanta Fed’s GDPNow model is tracking third-quarter growth above 5%, powered by consumer spending and private investment:
 Source: @lizthomasstrat via the Daily Chartbook on 9/16/2026
3. The 10-year yield is pushing toward 5%, but breakevens have barely moved:
 Source: John Authers, Points of Return
4. Financial conditions are the loosest they’ve been since at least 2009:
 Source: John Authers, Points of Return
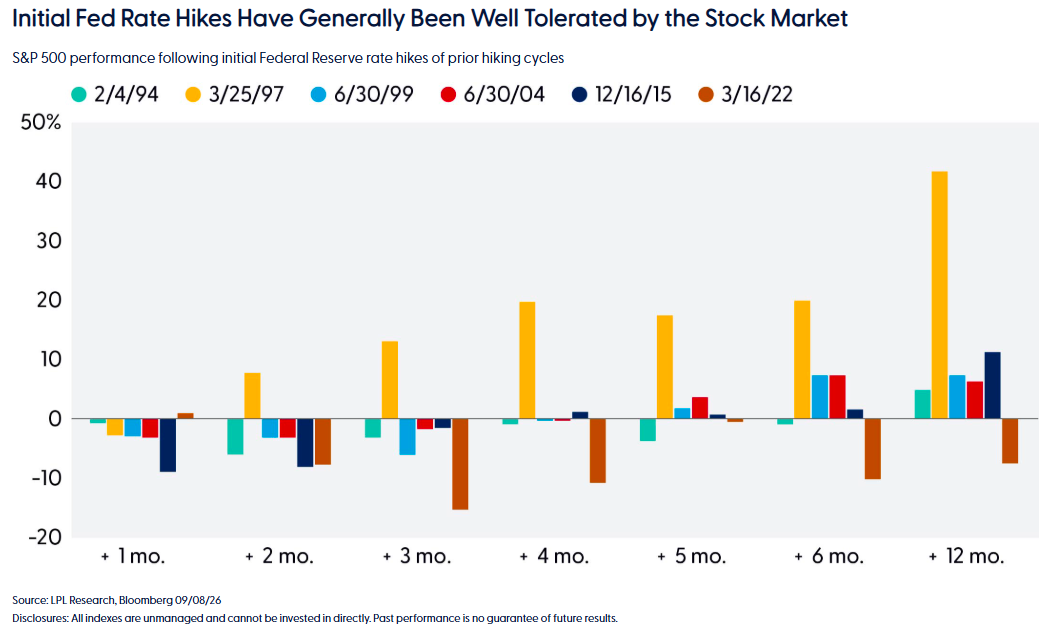
5. Historically, the stock market has tolerated the first rate hike of a cycle well, 2022 being the notable exception:
 Source: John Authers, Points of Return
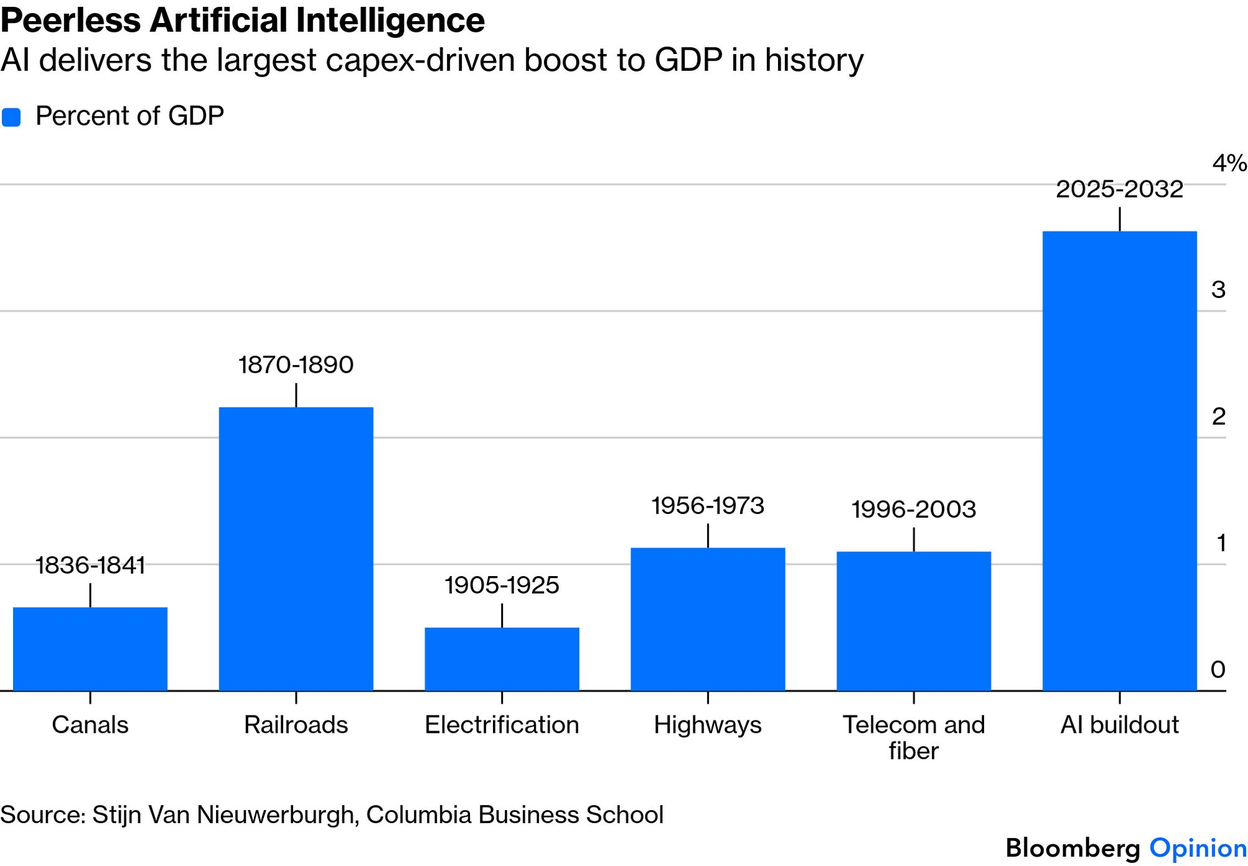
6. As a share of GDP, we’re on pace to spend more building out AI than we did building the nation’s railroads:
 Source: John Authers, Points of Return
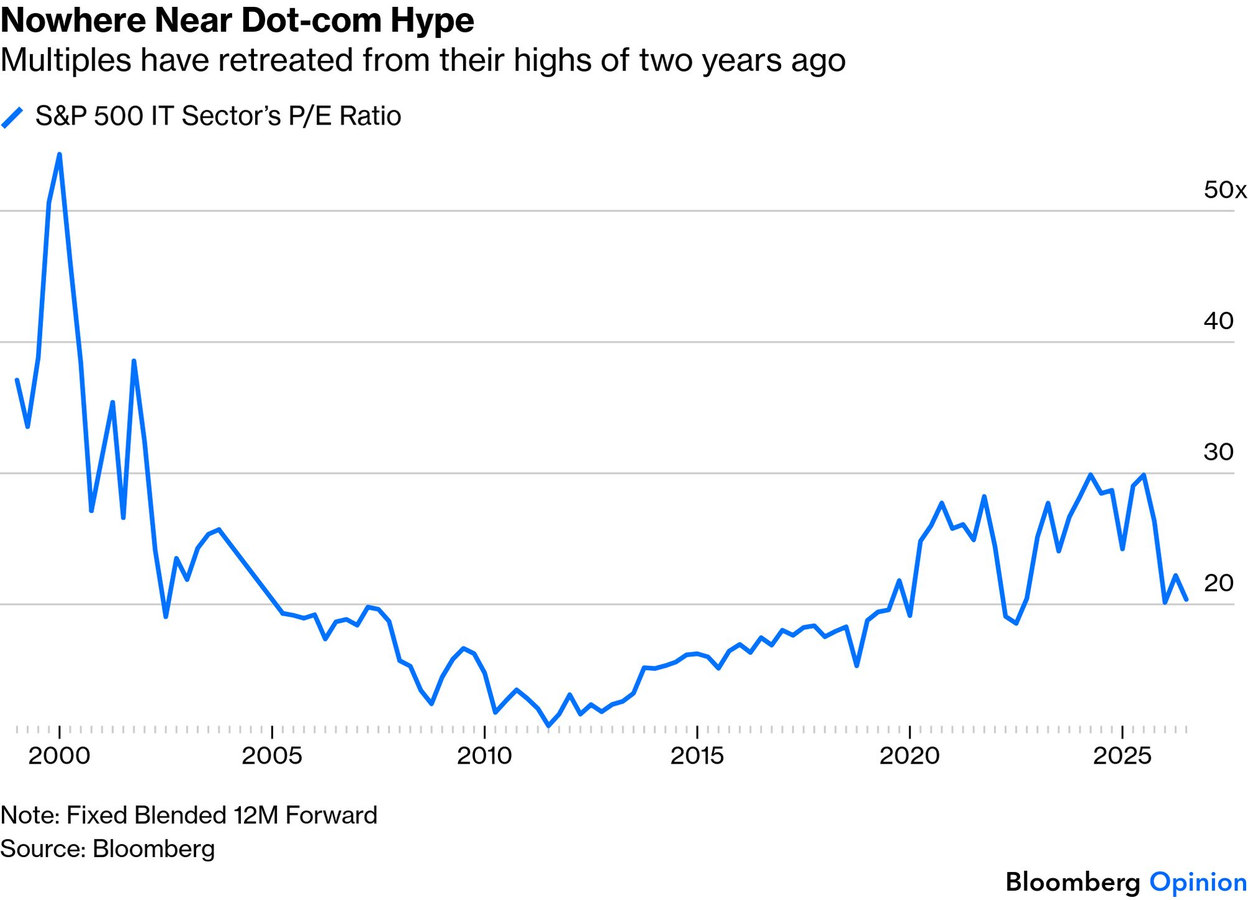
7. Tech valuations are nowhere near dot-com levels, with the sector’s forward P/E back near 20x:
 Source: John Authers, Points of Return
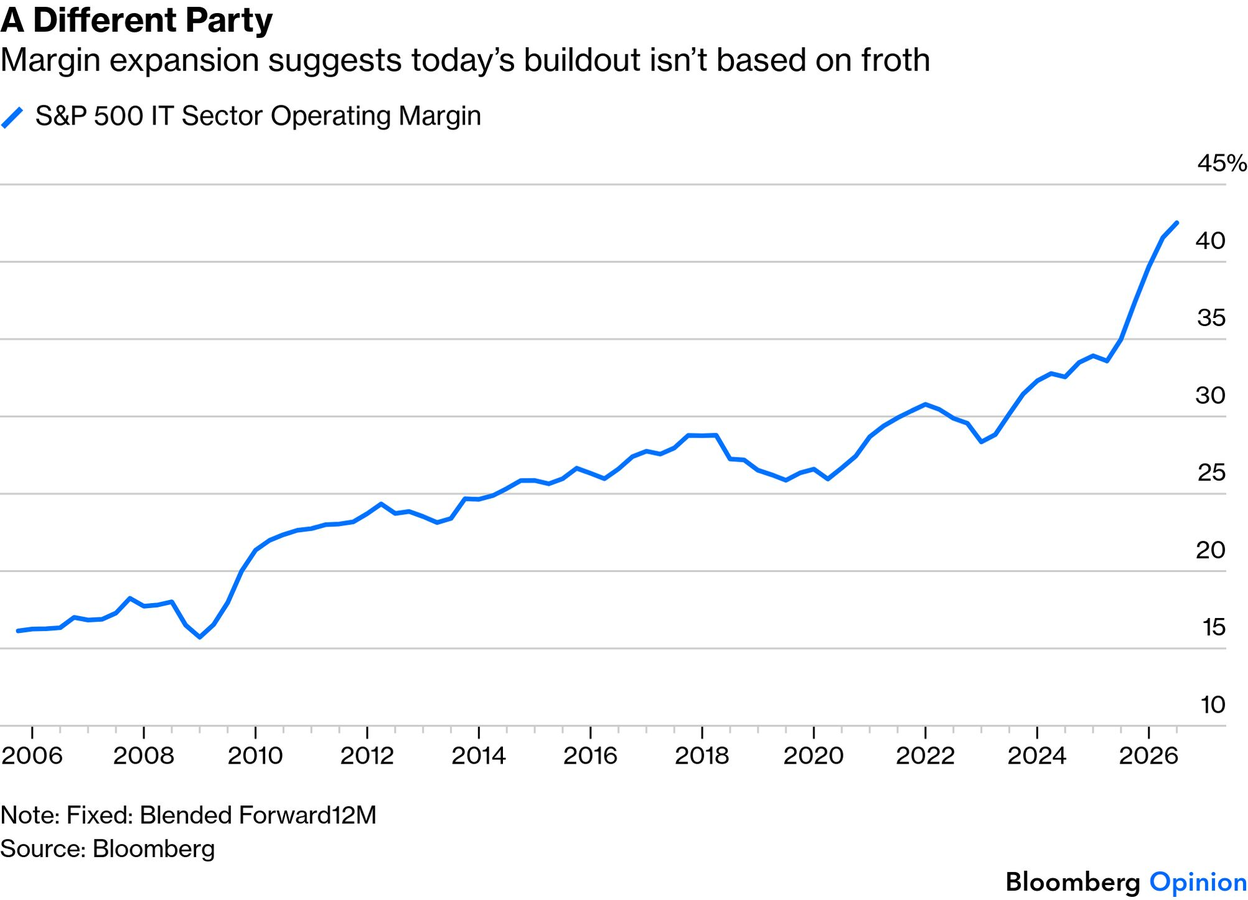
8. But that multiple rests on the highest operating margins in at least two decades:
 Source: John Authers, Points of Return
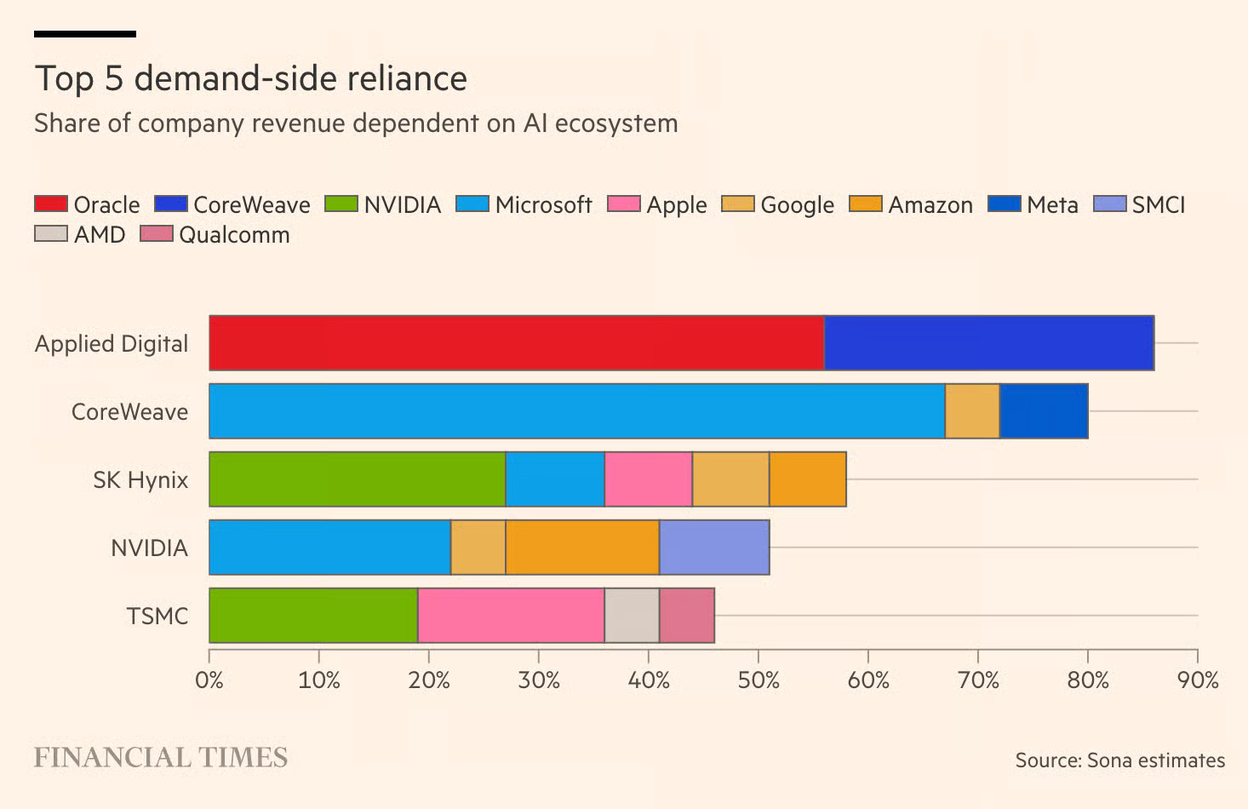
9. And the buildout’s suppliers depend on a handful of customers. For some, roughly 80% or more of revenue is tied to the AI ecosystem:
 Source: Toby Nangle, Financial Times via the Daily Chartbook on 9/18/2026
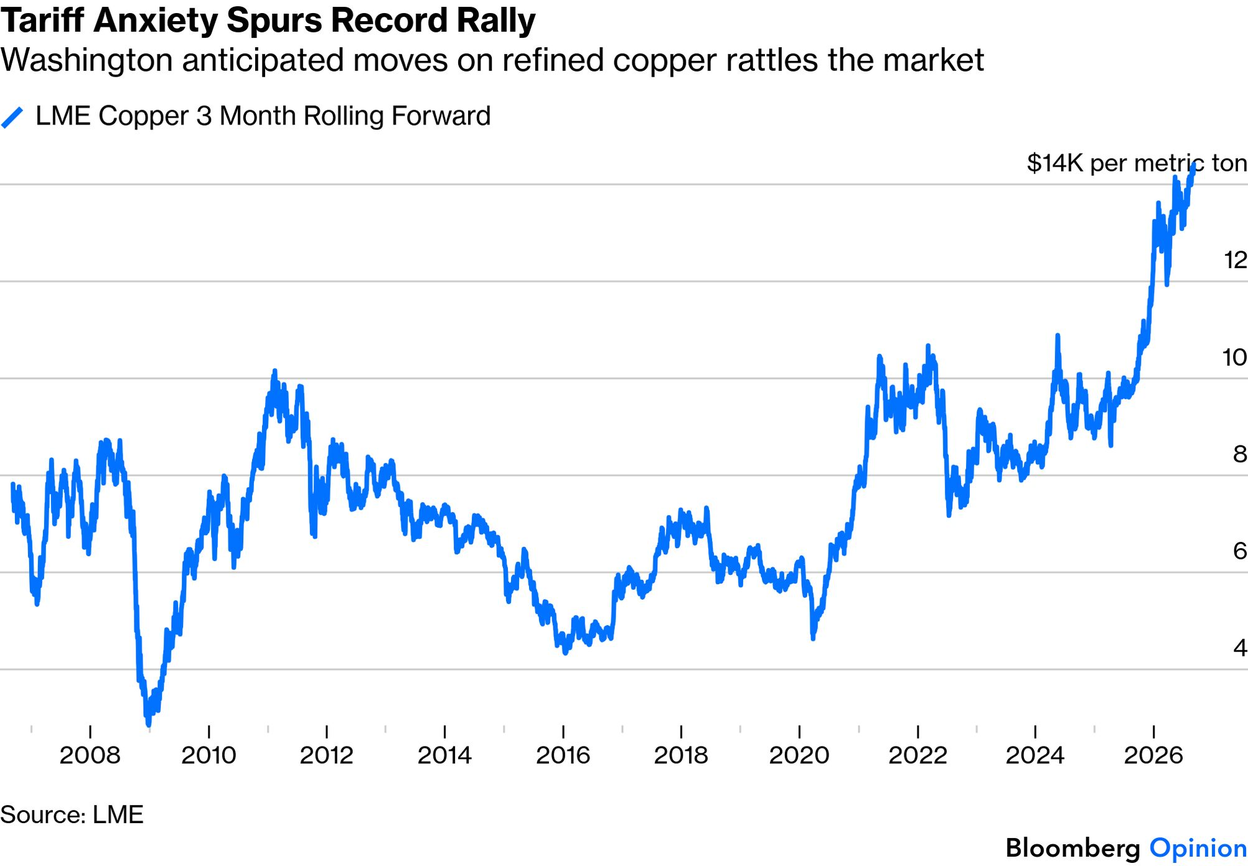
10. Copper reached a record near $14,000 per metric ton:
 Source: John Authers, Points of Return
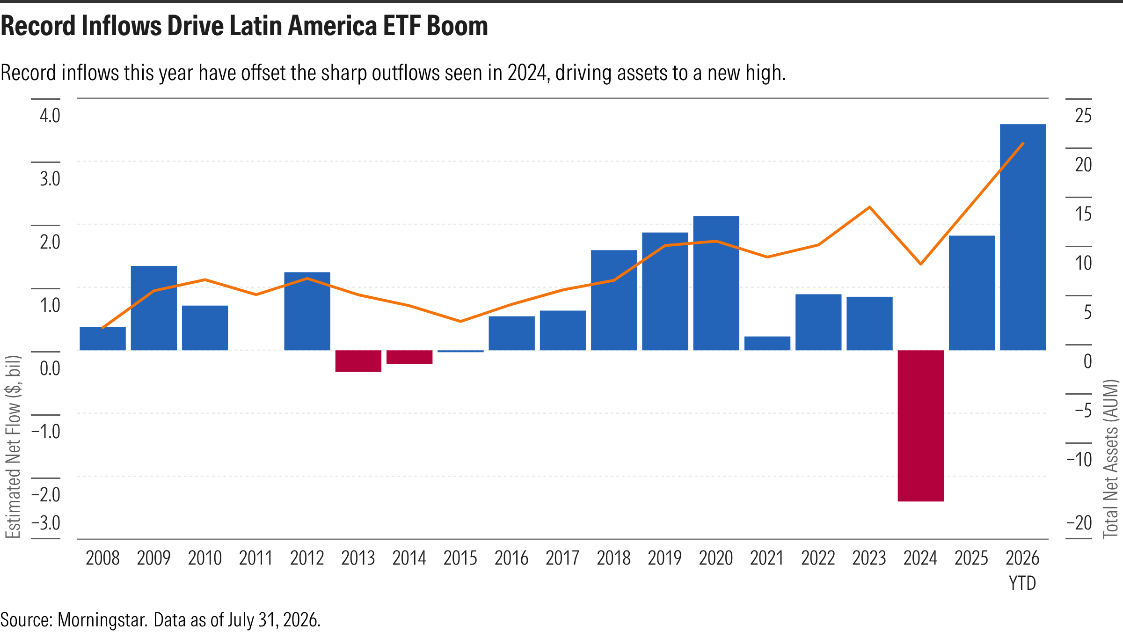
11. Commodity-rich Latin America has drawn record ETF inflows this year:
 Source: John Authers, Points of Return
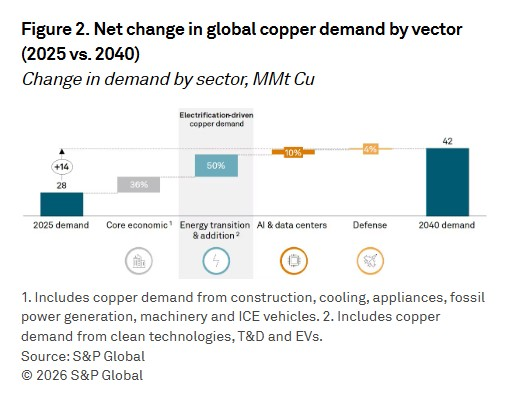
12. Despite the hype, AI and data centers account for only 10% of the expected growth in copper demand through 2040. The energy transition does the heavy lifting, at half the growth:
 Source: John Authers, Points of Return
Disclosures:
Copyright © 2026 Algorithmic Investment Models LLC (AIM). All rights reserved. All materials appearing in this commentary are protected by copyright as a collective work or compilation under U.S. copyright laws and are the property of Algorithmic Investment Models. You may not copy, reproduce, publish, use, create derivative works, transmit, sell or in any way exploit any content, in whole or in part, in this commentary without express permission from Algorithmic Investment Models.
Certain information contained herein constitutes “forward-looking statements,” which can be identified by the use of forward-looking terminology such as “may,” “will,” “should,” “expect,” “anticipate,” “project,” “estimate,” “intend,” “continue,” or “believe,” or the negatives thereof or other variations thereon or comparable terminology. Due to various risks and uncertainties, actual events, results or actual performance may differ materially from those reflected or contemplated in such forward-looking statements. Nothing contained herein may be relied upon as a guarantee, promise, assurance or a representation as to the future.
This material is provided for informational purposes only and does not in any sense constitute a solicitation or offer for the purchase or sale of a specific security or other investment options, nor does it constitute investment advice for any person. The material may contain forward or backward-looking statements regarding intent, beliefs regarding current or past expectations. The views expressed are also subject to change based on market and other conditions. The information presented in this report is based on data obtained from third party sources. Although it is believed to be accurate, no representation or warranty is made as to its accuracy or completeness.
The charts and infographics contained in this blog are typically based on data obtained from third parties and are believed to be accurate. The commentary included is the opinion of the author and subject to change at any time. Any reference to specific securities or investments are for illustrative purposes only and are not intended as investment advice nor are they a recommendation to take any action. Individual securities mentioned may be held in client accounts. Past performance is no guarantee of future results.
As with all investments, there are associated inherent risks including loss of principal. Stock markets, especially foreign markets, are volatile and can decline significantly in response to adverse issuer, political, regulatory, market, or economic developments. Sector and factor investments concentrate in a particular industry or investment attribute, and the investments’ performance could depend heavily on the performance of that industry or attribute and be more volatile than the performance of less concentrated investment options and the market as a whole. Securities of companies with smaller market capitalizations tend to be more volatile and less liquid than larger company stocks. Foreign markets, particularly emerging markets, can be more volatile than U.S. markets due to increased political, regulatory, social or economic uncertainties. Fixed Income investments have exposure to credit, interest rate, market, and inflation risk. Diversification does not ensure a profit or guarantee against a loss.
The S&P Global US Purchasing Managers’ Index (PMI) surveys are monthly measures of business conditions based on responses from purchasing managers at U.S. manufacturing and services companies; readings above 50 indicate expansion and readings below 50 indicate contraction. The Composite PMI Output Index combines manufacturing output and services business activity. The 10-Year Treasury Yield represents the interest rate on U.S. government debt securities with a maturity of ten years and is commonly used as a benchmark for long-term interest rates. The Bloomberg US Financial Conditions Index tracks the overall level of financial stress in U.S. money, bond and equity markets; positive values indicate looser-than-average financial conditions and negative values indicate tighter-than-average conditions. The S&P 500 Index measures the performance of 500 large-capitalization U.S. companies. The S&P 500 Information Technology Sector Index comprises the companies within the S&P 500 that are classified in the information technology sector under the Global Industry Classification Standard (GICS). The LME Copper 3-Month price is the price of copper for delivery in three months on the London Metal Exchange and is widely used as the global benchmark price for copper. Gross domestic product (GDP) is the total monetary value of all finished goods and services produced within a country’s borders during a specific period and is a broad measure of overall economic activity. Inflation is the rate at which the general level of prices for goods and services rises over time, resulting in a decline in purchasing power.
Please contact your AIM Regional Consultant for more information or to address any questions that you may have.
Algorithmic Investment Models LLC (AIM), 125 Newbury St. 4th Floor, Boston, MA 02116 (844-401-7699)