A market built on AI and the “Magnificent 8”.
Over the past several years we’ve watched the S&P 500’s performance become increasingly tethered to a handful of Mega-cap technology companies. Most broad market indices are market-capitalization weighted, so when a few enormous firms surge – as they have during this ongoing Artificial Intelligence boom – they pull the entire index higher.
The chart below shows just how extreme the divergence has been. Over the past three years the market cap weighted S&P 500 (SPY) has returned roughly 70.9%, while the equal-weight S&P 500 (EQL) returned 49.4%. This sprawling gap underscores how much investors have been rewarded for crowding into the largest names.
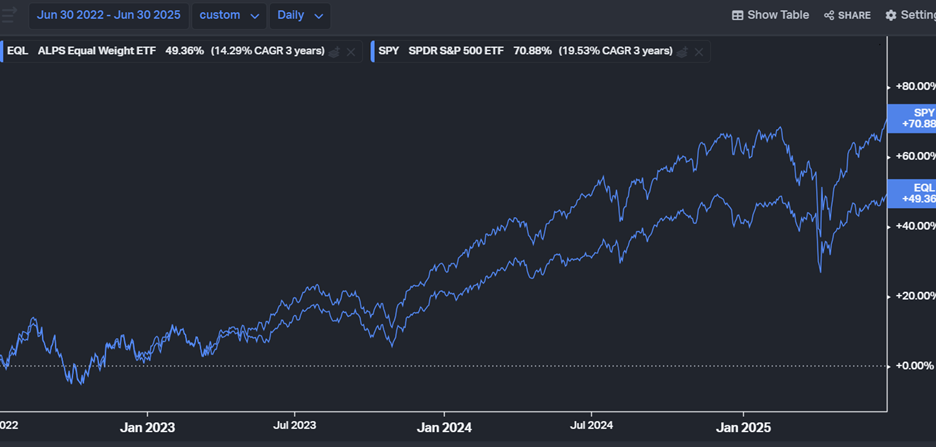 Source: Bloomberg, AIM. Data for the period 6/30/2022 through 6/30/2025.
Complacency can be dangerous.
The S&P 500, by many measures, is now as concentrated as ever, meaning investors are effectively betting on a subset of eight (ish) businesses. This subset of companies, once relatively independent, are now all competing in AI, concentrating risk.
History shows that the companies that lead the market up tend to lead the market down. In the most recent three periods of concentration, it was:
- Tech bubble in 2000 with Software and Internet Infrastructure
- In 2008, it was Financials and Energy and
- Now we again have Tech and AI related companies making up a significant part of the index.
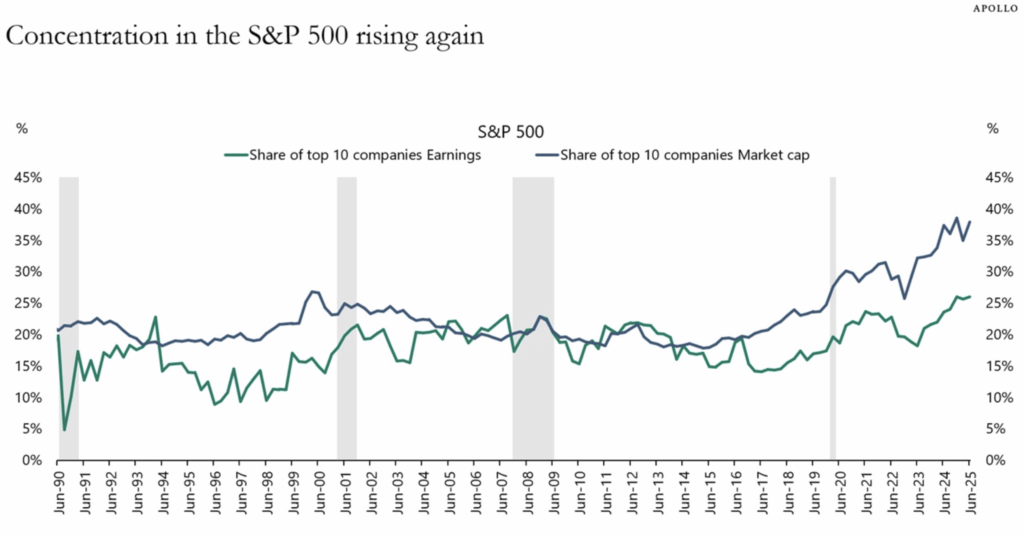 Source: Apollo. The Daily Spark. “Extreme Concentration in the S&P 500”, 7/10/2025.
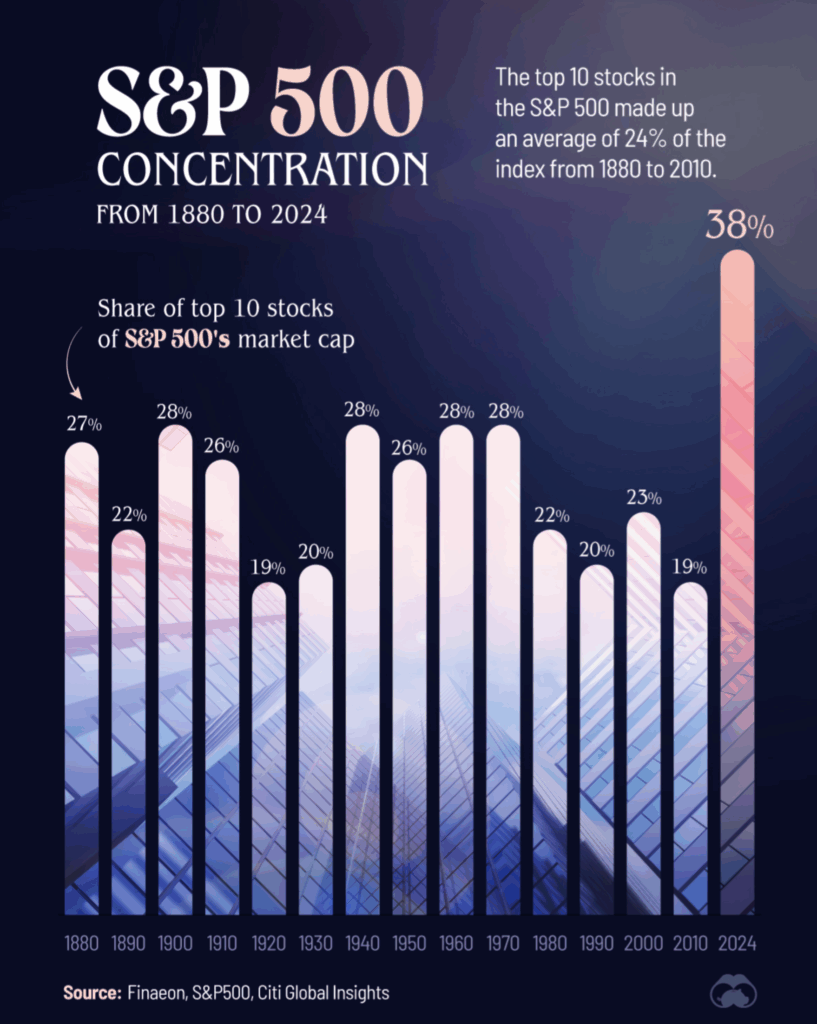
And when leadership changes (as it has throughout time), the downfall may be exacerbated by the fact that these leaders are now so concentrated in a single theme.
Recent pullbacks show the market’s hand.
The leaders driving the market up have also led it on the way down during recent pullbacks. As seen in the chart below, during the broad market correction in 2022, the equal-weight S&P 500 fell a tolerable 10.6% while the traditional, market-cap weighted index slumped 18.2%. In other words, spreading exposure evenly across sectors cut the drawdown almost in half. The 2022 selloff was one of the few prolonged downturns since the pandemic and highlighted how diversification can help protect investors when the biggest stocks stumble, even when bonds themselves offered little help.
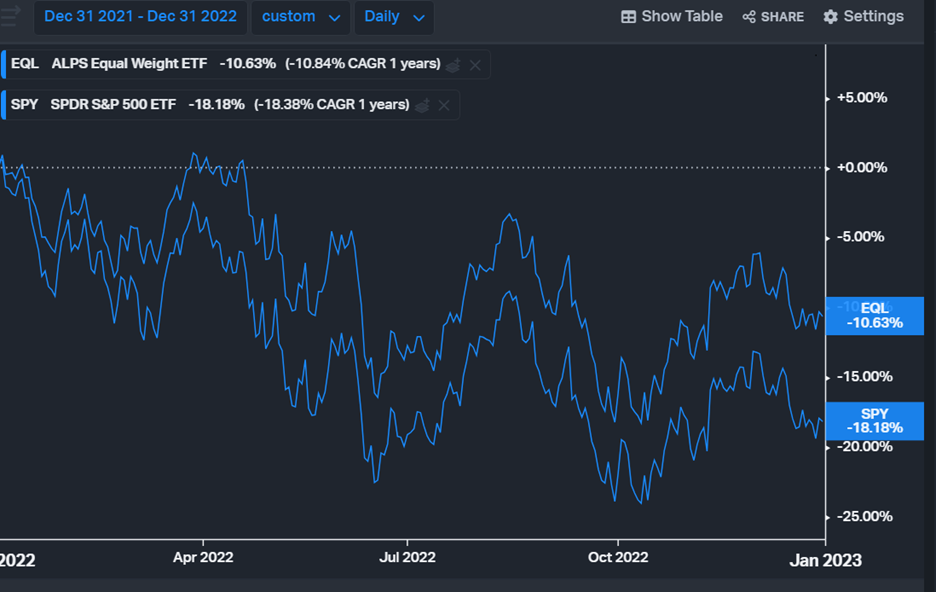 Source: Bloomberg, AIM. Data for the period 12/31/2021 through 12/31/2022.
A similar pattern played out in the early months of 2025. As tariffs and macro concerns sparked volatility, the S&P 500 fell 15% from the beginning of the year while an equal-weight sector basket fell just 10%. Both foreign stocks and bonds had positive returns in the first quarter. Foreign stocks and bonds, long beleaguered diversifiers, also significantly outperformed. The weak relative performers were a near perfect inverse of those that led it on the way up.
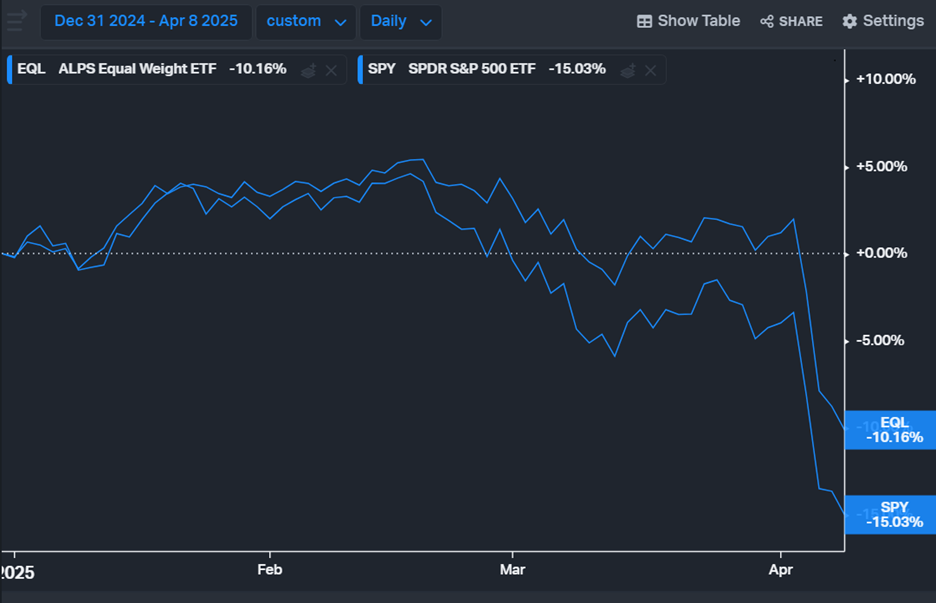 Source: Bloomberg, AIM. Data for the period 12/31/2024 through 4/8/2025.
Although the market has since rebounded and investors seemingly believe that tariffs will have little economic impact, these sell offs are proof that diversification can work when markets are stressed.
Preparing your portfolio for what comes next.
History has shown that index concentration is a function of enduring bull markets such as what we have observed for much of the last 15 years or more. It has also shown that investors can pay a hefty penalty for concentration when those bull markets stall out, showcasing the true value of diversification. When the largest stocks falter, they tend to drag market cap indices with them, while the average stock, sector or foreign market can still deliver positive or relatively stronger returns, helping to smooth the ride for investors. Markets rarely move in a straight line, and regimes dominated by a small group of winners eventually give way to periods where breadth matters again.
Given how long these trends have persisted, I believe the defensive value of a rules-based, diversified approach is higher than ever.
Our Sector Rotation strategies can help diversify and protect investor portfolios through two main risk mitigation mechanisms:
- Trend following: Incorporating moving average-based portfolio management rules allows us to reduce risk when markets break down and reenter when they stabilize. This systematic component is designed to avoid the worst of prolonged bear markets.
- Equal weighting: Weighting each sector equally rather than by market cap redistributes exposure away from the largest names meaning more diversification and less concentration and whipsaw risk.
This approach aims to help risk averse investors participate in equity markets without making an implicit bet on a handful of tech giants. We are seeking to capture upside when the market’s offering it and reduce exposure when markets weaken.
Now is the time to reconsider whether your portfolio is diversified enough to withstand a shift in market leadership. Markets driven by a small group of stocks can deliver impressive returns – until they don’t. With valuations elevated and macro risks rising, a defensive, diversified approach isn’t just prudent; it may be essential.
Looking for defense and diversification? Contact us.
Disclosures:
Copyright © 2025 Algorithmic Investment Models LLC. All rights reserved. All materials appearing in this commentary are protected by copyright as a collective work or compilation under U.S. copyright laws and are the property of Algorithmic Investment Models. You may not copy, reproduce, publish, use, create derivative works, transmit, sell or in any way exploit any content, in whole or in part, in this commentary without express permission from Algorithmic Investment Models.
Certain information contained herein constitutes “forward-looking statements,” which can be identified by the use of forward-looking terminology such as “may,” “will,” “should,” “expect,” “anticipate,” “project,” “estimate,” “intend,” “continue,” or “believe,” or the negatives thereof or other variations thereon or comparable terminology. Due to various risks and uncertainties, actual events, results or actual performance may differ materially from those reflected or contemplated in such forward-looking statements. Nothing contained herein may be relied upon as a guarantee, promise, assurance or a representation as to the future.
This material is provided for informational purposes only and does not in any sense constitute a solicitation or offer for the purchase or sale of a specific security or other investment options, nor does it constitute investment advice for any person. The material may contain forward or backward-looking statements regarding intent, beliefs regarding current or past expectations. The views expressed are also subject to change based on market and other conditions. The information presented in this report is based on data obtained from third party sources. Although it is believed to be accurate, no representation or warranty is made as to its accuracy or completeness.
The charts and infographics contained in this blog are typically based on data obtained from third parties and are believed to be accurate. The commentary included is the opinion of the author and subject to change at any time. Any reference to specific securities or investments are for illustrative purposes only and are not intended as investment advice nor are they a recommendation to take any action. Individual securities mentioned may be held in client accounts. Past performance is no guarantee of future results.
As with all investments, there are associated inherent risks including loss of principal. Stock markets, especially foreign markets, are volatile and can decline significantly in response to adverse issuer, political, regulatory, market, or economic developments. Sector and factor investments concentrate in a particular industry or investment attribute, and the investments’ performance could depend heavily on the performance of that industry or attribute and be more volatile than the performance of less concentrated investment options and the market as a whole. Securities of companies with smaller market capitalizations tend to be more volatile and less liquid than larger company stocks. Foreign markets, particularly emerging markets, can be more volatile than U.S. markets due to increased political, regulatory, social or economic uncertainties. Fixed Income investments have exposure to credit, interest rate, market, and inflation risk. Diversification does not ensure a profit or guarantee against a loss.
The S&P 500 Index measures the performance of 500 large U.S. companies across various industries and is weighted by market capitalization, giving larger companies greater influence on the index. The S&P 500 Equal Weight Index includes the same companies but assigns each an equal weight, offering a better representation of the “average” stock’s performance.
Please contact your AIM Regional Consultant for more information or to address any questions that you may have.
Algorithmic Investment Models LLC (AIM)
125 Newbury St., 4th Floor, Boston, MA 02116 (844-401-7699)