Hello Readers,
Brendan Ryan here. You usually see Denis in these videos but I’ll explain in the video why I’m covering this week. Its been a little while since we recorded our chart blog video but we thought this week we should shed a little bit more light on who is bearing the brunt of the tariffs right now. Despite popular belief, according to Goldman Sachs, companies have shouldered the majority of the burden… so far. Watch this quick video and continue reading for more from Fireside Charts this week.
Denis should be back for the next video blog update. Enjoy the last few weeks of summer!
Thanks for being here,
Brendan Ryan, Portfolio Manager
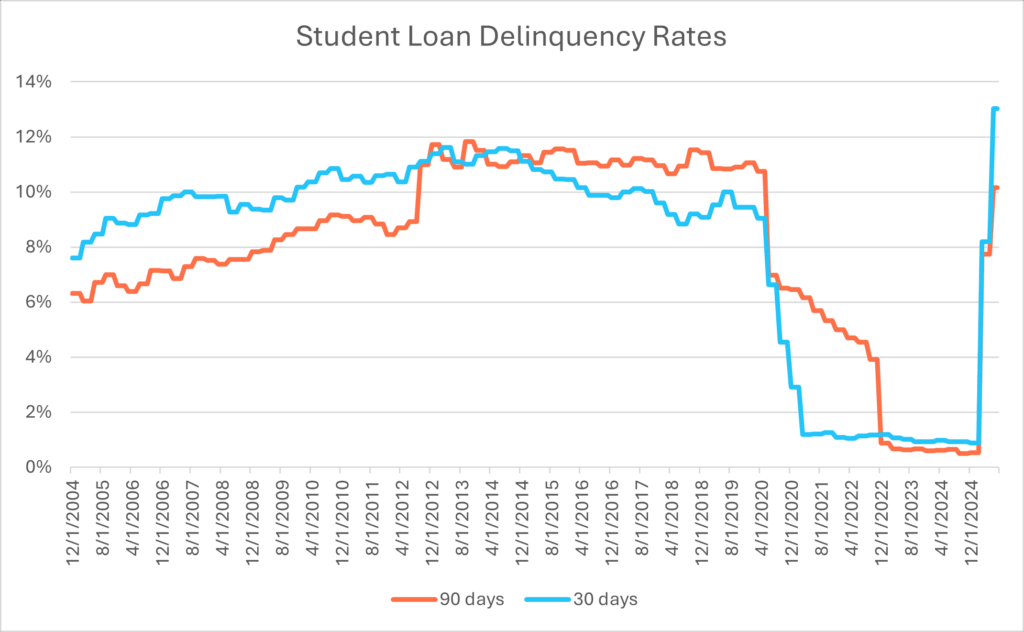
Recent data highlights a growing divergence between headline narratives and what’s happening beneath the surface. As U.S. imports from China decline, global trade appears to be rerouting through other countries. Market breadth continues to narrow, even as major indices push higher. While tariffs are contributing to a modest pickup in goods inflation, corporations—not consumers—have absorbed most of the impact so far. Meanwhile, AI isn’t to blame for a slow job market for recent grads. Student loan delinquencies are beginning to climb again.
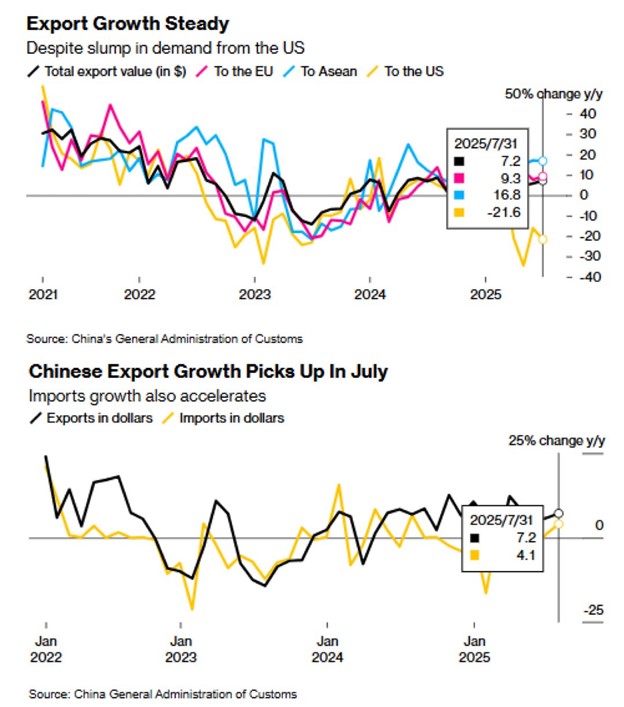
1. So far the rest of the world is filling the gap left by the US purchasing less Chinese goods
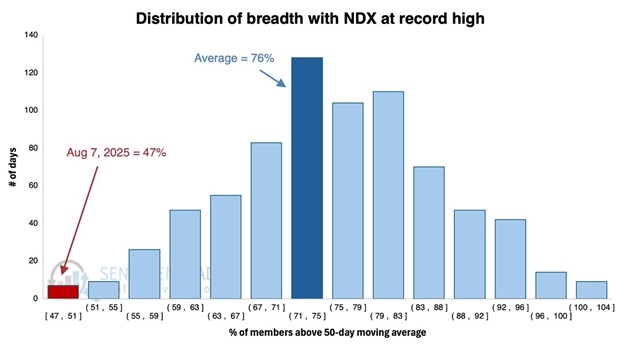
2. “Bad breadth” has been an overused pun for this top heavy market but dare we ask if the market is running out of breadth?
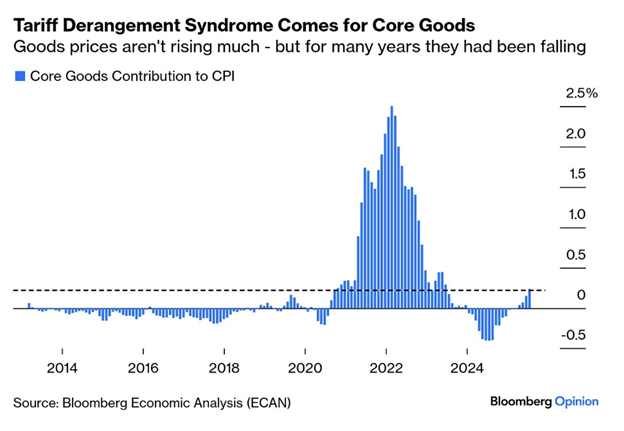
3. For years overall CPI benefitted from low to declining goods prices, but it looks like tariffs have begun to change that.
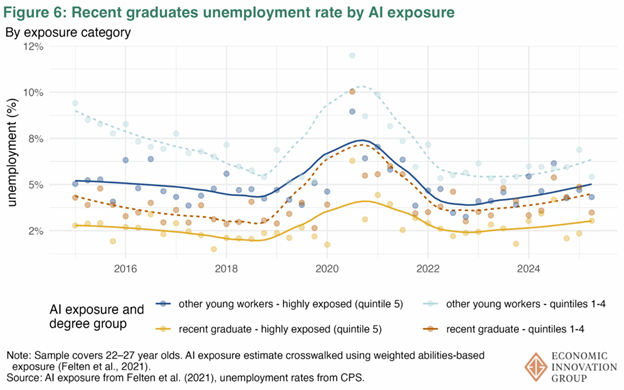
4. AI isn’t the reason for low hiring rates of recent college grads
5. So far corporations have eaten most of the tariffs
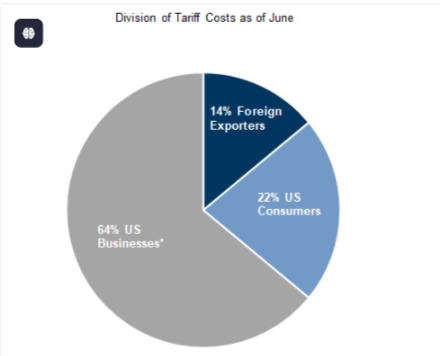
Chart Source: Goldman Sachs
6. The grace period for student loans is over:
Disclosures:
Copyright © 2025 Algorithmic Investment Models LLC (AIM). All rights reserved. All materials appearing in this commentary are protected by copyright as a collective work or compilation under U.S. copyright laws and are the property of Beaumont Capital Management. You may not copy, reproduce, publish, use, create derivative works, transmit, sell or in any way exploit any content, in whole or in part, in this commentary without express permission from Beaumont Capital Management.
Certain information contained herein constitutes “forward-looking statements,” which can be identified by the use of forward-looking terminology such as “may,” “will,” “should,” “expect,” “anticipate,” “project,” “estimate,” “intend,” “continue,” or “believe,” or the negatives thereof or other variations thereon or comparable terminology. Due to various risks and uncertainties, actual events, results or actual performance may differ materially from those reflected or contemplated in such forward-looking statements. Nothing contained herein may be relied upon as a guarantee, promise, assurance or a representation as to the future.
This material is provided for informational purposes only and does not in any sense constitute a solicitation or offer for the purchase or sale of a specific security or other investment options, nor does it constitute investment advice for any person. The material may contain forward or backward-looking statements regarding intent, beliefs regarding current or past expectations. The views expressed are also subject to change based on market and other conditions. The information presented in this report is based on data obtained from third party sources. Although it is believed to be accurate, no representation or warranty is made as to its accuracy or completeness.
The charts and infographics contained in this blog are typically based on data obtained from third parties and are believed to be accurate. The commentary included is the opinion of the author and subject to change at any time. Any reference to specific securities or investments are for illustrative purposes only and are not intended as investment advice nor are they a recommendation to take any action. Individual securities mentioned may be held in client accounts. Past performance is no guarantee of future results.
As with all investments, there are associated inherent risks including loss of principal. Stock markets, especially foreign markets, are volatile and can decline significantly in response to adverse issuer, political, regulatory, market, or economic developments. Sector and factor investments concentrate in a particular industry or investment attribute, and the investments’ performance could depend heavily on the performance of that industry or attribute and be more volatile than the performance of less concentrated investment options and the market as a whole. Securities of companies with smaller market capitalizations tend to be more volatile and less liquid than larger company stocks. Foreign markets, particularly emerging markets, can be more volatile than U.S. markets due to increased political, regulatory, social or economic uncertainties. Fixed Income investments have exposure to credit, interest rate, market, and inflation risk. Diversification does not ensure a profit or guarantee against a loss.
The Nasdaq-100 Index (NDX) is a modified market-capitalization-weighted index that includes 100 of the largest non-financial companies listed on the Nasdaq Stock Market. Core Goods CPI refers to the Consumer Price Index for goods, excluding food and energy, which helps isolate underlying inflation trends in the goods sector.
Please contact your AIM Regional Consultant for more information or to address any questions that you may have.
Algorithmic Investment Models LLC (AIM), 125 Newbury St. 4th Floor, Boston, MA 02116 (844-401-7699)