U.S. equity markets are beginning to feel downright frothy as investors chase the rally and pile into some of the most speculative companies. While equity markets began the year with broad gains, performance has narrowed in recent weeks. Recent hard economic data has come in weaker than expected, as tariffs begin to bite. What’s going on with the U.S. Dollar? Hyperscaler capex. Buy high, sell higher?
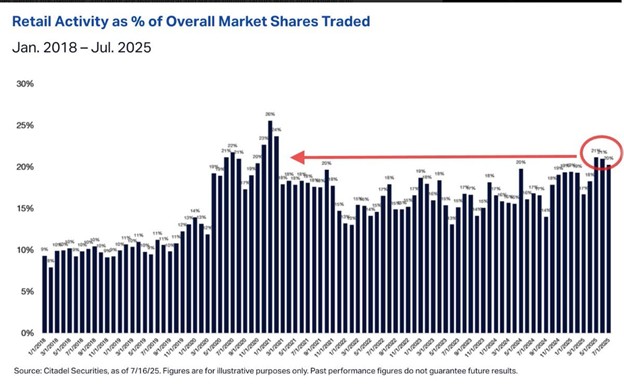
1. Retail activity is approaching levels last seen in the 2021 meme-stock craze:
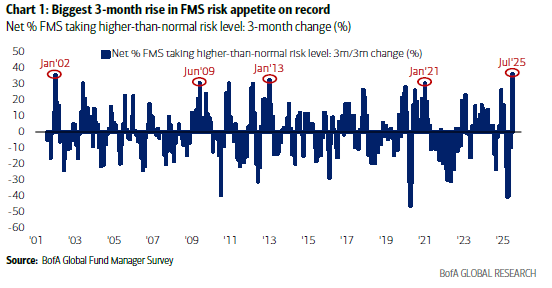
2. But it’s not just retail:
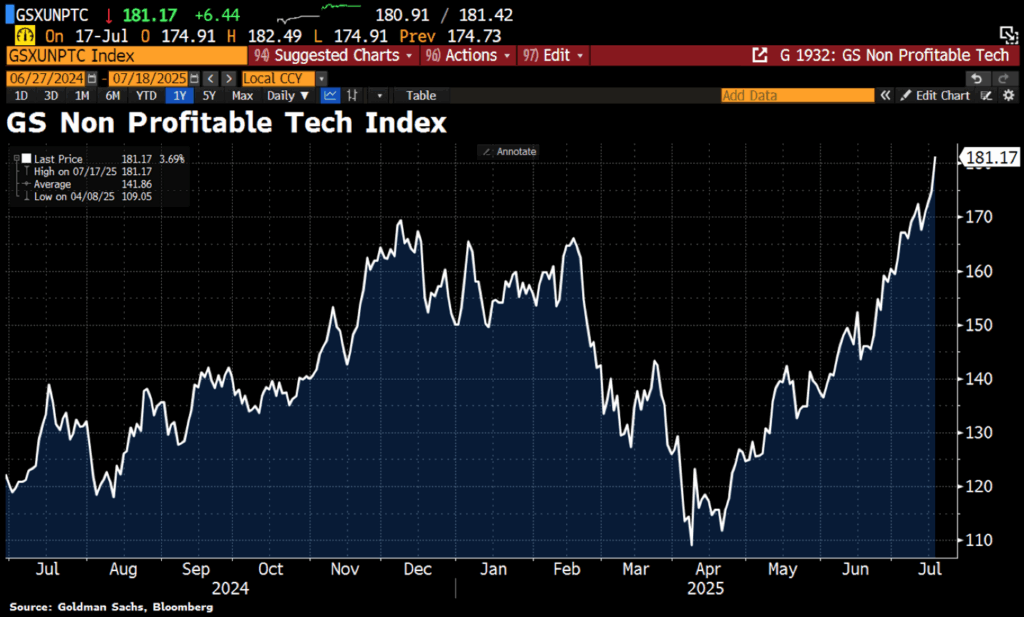
3. Unprofitable technology companies are screaming higher:
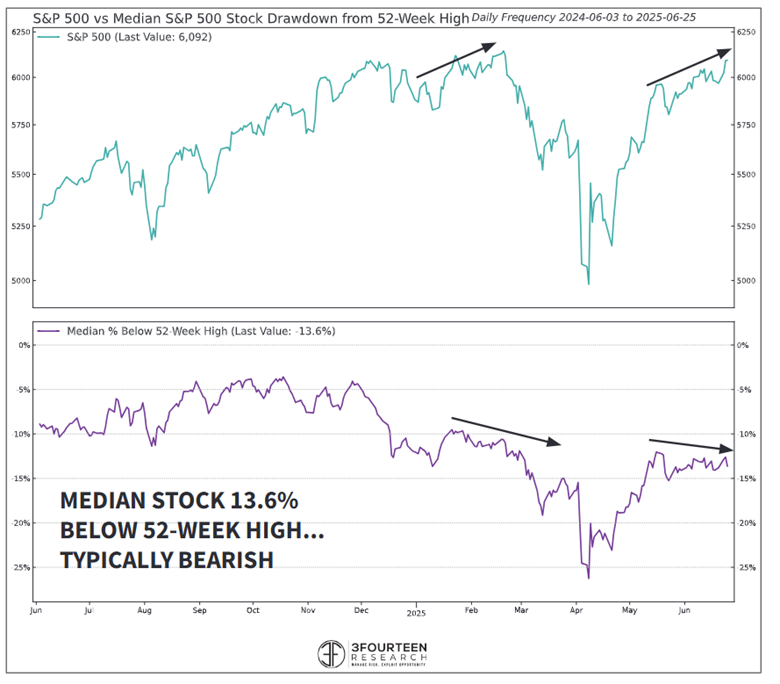
4. The drawdown for the median S&P 500 stock is trending in the wrong direction:
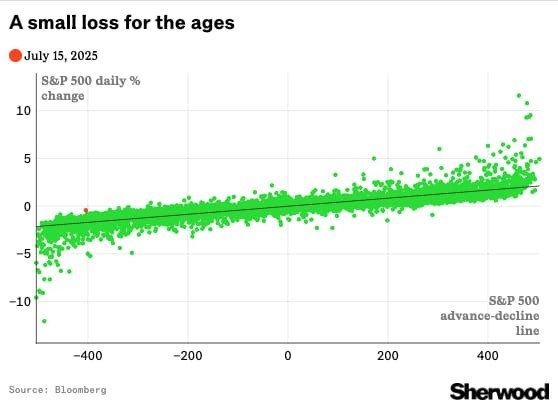
5. Last Tuesday was notable for being the smallest decline in the S&P 500 on a day when over 400 of its constituents traded lower, with data going back to 1997:
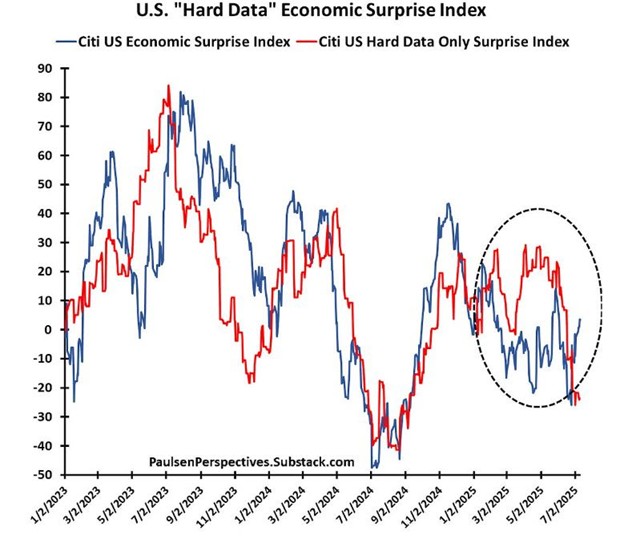
6. Despite the disappointing hard data, soft data has improved recently:
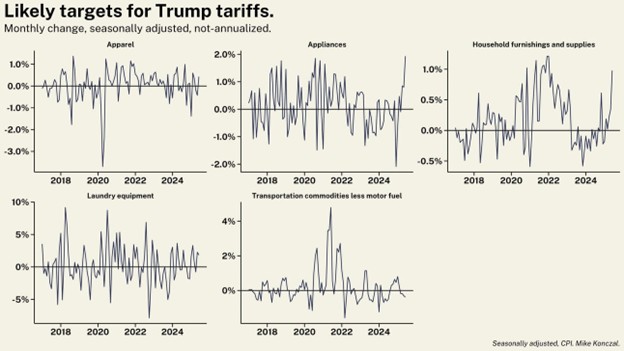
7. Recent Consumer Price Index (CPI) data showed price hikes in industries most directly affected by tariffs:
8. Recently, the Dollar has been marching to the beat of its own drum after years of realizing a consistently negative correlation to equities:
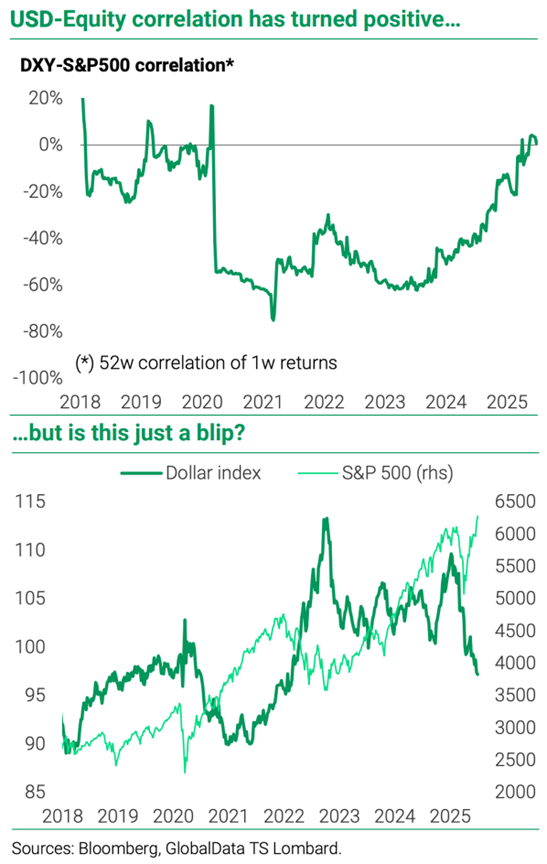
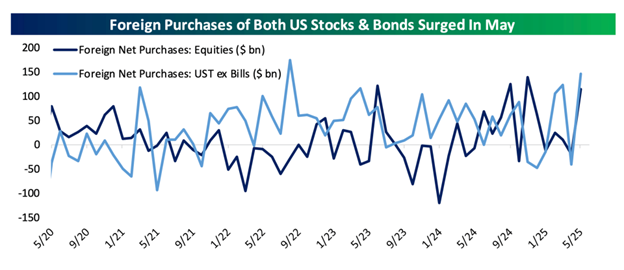
9. Speculation that weakness in the U.S. Dollar was caused by fleeing international investors turned out to be just that:
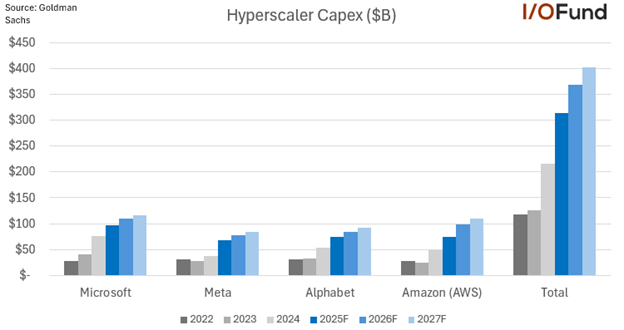
10. Big tech is becoming the most capital-intensive industry in the world:
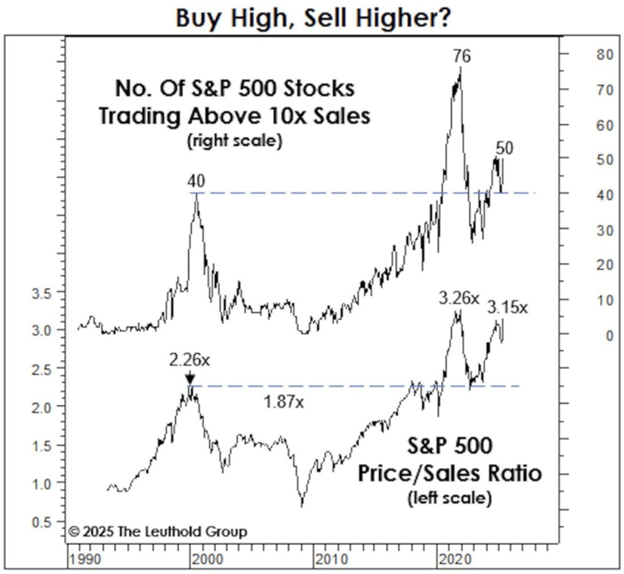
11. Simple comparisons to the past should be taken with a grain of salt, but we believe that the price that you pay will matter for long-term returns:
Disclosures:
Copyright © 2025 Algorithmic Investment Models LLC (AIM). All rights reserved. All materials appearing in this commentary are protected by copyright as a collective work or compilation under U.S. copyright laws and are the property of Beaumont Capital Management. You may not copy, reproduce, publish, use, create derivative works, transmit, sell or in any way exploit any content, in whole or in part, in this commentary without express permission from Beaumont Capital Management.
Certain information contained herein constitutes “forward-looking statements,” which can be identified by the use of forward-looking terminology such as “may,” “will,” “should,” “expect,” “anticipate,” “project,” “estimate,” “intend,” “continue,” or “believe,” or the negatives thereof or other variations thereon or comparable terminology. Due to various risks and uncertainties, actual events, results or actual performance may differ materially from those reflected or contemplated in such forward-looking statements. Nothing contained herein may be relied upon as a guarantee, promise, assurance or a representation as to the future.
This material is provided for informational purposes only and does not in any sense constitute a solicitation or offer for the purchase or sale of a specific security or other investment options, nor does it constitute investment advice for any person. The material may contain forward or backward-looking statements regarding intent, beliefs regarding current or past expectations. The views expressed are also subject to change based on market and other conditions. The information presented in this report is based on data obtained from third party sources. Although it is believed to be accurate, no representation or warranty is made as to its accuracy or completeness.
The charts and infographics contained in this blog are typically based on data obtained from third parties and are believed to be accurate. The commentary included is the opinion of the author and subject to change at any time. Any reference to specific securities or investments are for illustrative purposes only and are not intended as investment advice nor are they a recommendation to take any action. Individual securities mentioned may be held in client accounts. Past performance is no guarantee of future results.
As with all investments, there are associated inherent risks including loss of principal. Stock markets, especially foreign markets, are volatile and can decline significantly in response to adverse issuer, political, regulatory, market, or economic developments. Sector and factor investments concentrate in a particular industry or investment attribute, and the investments’ performance could depend heavily on the performance of that industry or attribute and be more volatile than the performance of less concentrated investment options and the market as a whole. Securities of companies with smaller market capitalizations tend to be more volatile and less liquid than larger company stocks. Foreign markets, particularly emerging markets, can be more volatile than U.S. markets due to increased political, regulatory, social or economic uncertainties. Fixed Income investments have exposure to credit, interest rate, market, and inflation risk. Diversification does not ensure a profit or guarantee against a loss.
The federal funds rate is the interest rate at which banks lend money to each other overnight. A treasury yield is the interest rate the U.S. government pays on its debt, and the annual return that investors can expect from holding a U.S. government security. The U.S. Dollar Index is a geometrically-averaged calculation of six currencies weighted against the U.S. dollar. The Russell 2000 Index is a benchmark for U.S. small-cap stocks, measuring the performance of the 2,000 smallest companies in the broader Russell 3000 Index. The S&P 400 Index, also known as the S&P MidCap 400, measures the performance of 400 mid-sized U.S. companies and serves as a benchmark for the mid-cap segment of the market. The S&P 500 Index is a market-capitalization-weighted index of 500 leading publicly traded companies in the U.S. across various industries.
Please contact your AIM Regional Consultant for more information or to address any questions that you may have.
Algorithmic Investment Models LLC (AIM), 125 Newbury St. 4th Floor, Boston, MA 02116 (844-401-7699)