Prevailing themes.
The second quarter of 2025 started with a bang and ended with a whimper. In early April, markets incurred a roughly 20% drawdown[1] on the back of generally large and varied tariffs threatened by the United States on the rest of the World, signaling a major change to the world order of trade. As markets reacted negatively to this change, policymakers began to soften their tone and ultimately delayed the timeline for implementation. Markets again reacted and, just as fast as they fell, they recovered. By the end of the month, the S&P was down just 0.70% and Global stocks rose nearly 1%.[2]
While the administration appears committed to tariffs as a core part of U.S. economic policy, investor actions imply their ultimate impact will be immaterial. At the end of the quarter, uncertainty remained relatively high. Yet investors appear extremely confident, with some pockets of the market displaying a feverish appetite for risk assets. We believe this backdrop may yield an increasingly unfavorable risk/reward.
In the first quarter prior to the “Liberation Day”[3] announcement, we saw risks to all the prevailing market themes:
- Economic growth weakened,
- “Deepseek” threatened the prevailing AI narrative,
- Fixed income outperformed US equities, and
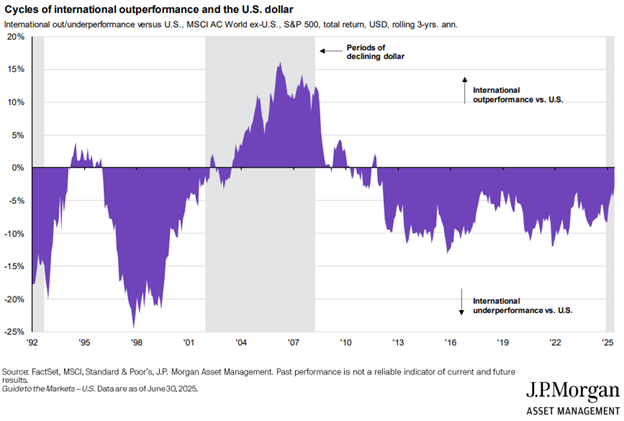
- International equities outperformed both US equities and fixed income.
Despite little hard evidence to dispel any of the trends seen in the first quarter, nearly all have been reversed in markets. All but one: International outperformance versus the U.S. A consistently weakening U.S. dollar has provided a tailwind, but other factors, most notably renewed government spending into the European economy, have helped create a potential tipping point for long beleaguered international investments.

The strategies move toward international.
Our strategies have been reluctant to hold significant international exposure throughout most of our investment history, but as the events of the quarter transpired, we saw our system increasingly move towards international equities – an exciting trend given how one-sided global equity leadership has been over the last 15+ years. As it stands, all of our Decathlon strategies have historically high levels of international exposure and are relatively diversified between Latin America, Europe and Asia.
The sharp drawdown and recovery created a dangerous situation for tactical strategies, but we navigated the volatile markets of early April well. At the onset of the quarter our strategies were defensively positioned. This allowed us to make an opportunistic risk-on purchase near the bottom in mid-April, slightly increasing equity exposure but shifting towards “juicier” equities which had generally fallen much further than the broad market to that point. After the market recovered, our strategies generally “took the gains” and reduced risk through the remainder of the quarter. While this has been premature in hindsight, we believe the market is increasingly showing signs of excess which could lead to downside in the near future.
We believe market bottoms are more obvious than market tops. Market bottoms have a clear signature; fear strikes all at once. However, investors typically become euphoric at different times. Tops don’t occur when everyone is suddenly euphoric but rather when there is no one left to become euphoric. We think this is why, historically, our models have been relatively opportunistic in pullbacks but have often gotten defensive preemptively. Tops are hard to predict but very worthwhile to avoid. Most importantly, our system is built to adapt. If the current portfolio is out of step with the market for too long, our models have demonstrated a willingness to shift their bets in short order, seeking new opportunities wherever they may be.
The result was a quarter with strong absolute performance but modest underperformance relative to our benchmarks, primarily in June when markets ran past their pre-Liberation Day levels. Over the past few years our strategies meaningfully outperformed a weighted average of equities and fixed income within our investment pool However, over that same time period having a diverse investment pool was a headwind for our performance as it was difficult to sufficiently overweight the small subset of equity markets which drove the majority of returns, even when they were correctly identified. As the tides have turned quickly for international stocks this year, we have seen a bit of the opposite phenomenon. If these trends continue, we believe it will provide a tailwind for our strategy relative to our asset allocation benchmarks.
Investors are amazingly confident.
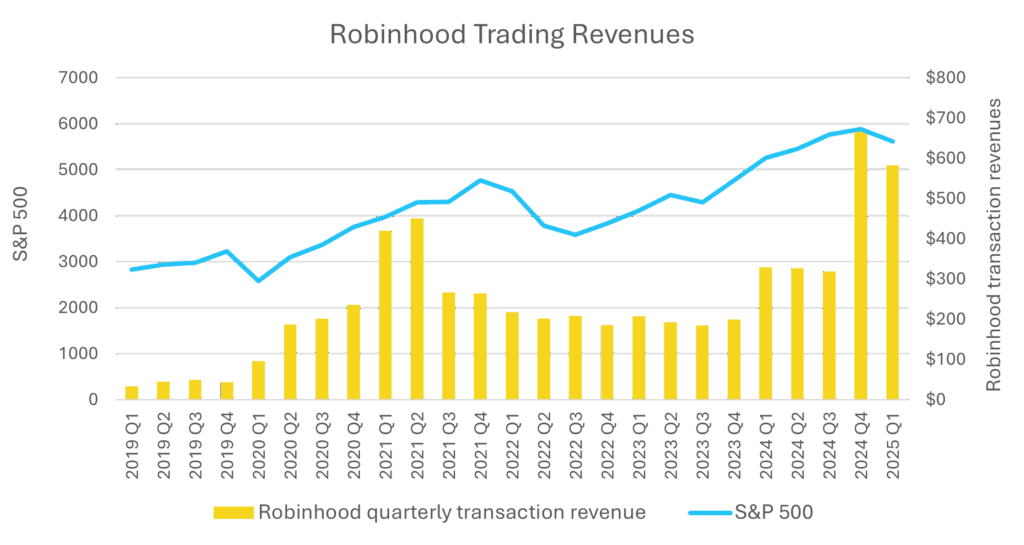
“Nothing ever happens” has become the dominant market theme as equity indices charge ahead regardless of headlines. Oil prices were roughly flat in a quarter with war in the Middle East. Speculative assets have soared to heights not seen since the IPO boom in 2021. Nearly all risk assets have outperformed. Retail-focused brokerage Robinhood is now generating higher revenues than at any point in its history. Even Special Purpose Acquisition Companies (SPACs), a shortcut to traditional IPOs, have returned. Bitcoin, now a decent proxy for investor risk appetite, made new highs and has political support. All of this points to complacent, risk-seeking behavior in markets. This type of behavior tends to occur much closer to the end of a strong rally than the beginning.

The economy is sending mixed signals.
While “the market isn’t the economy” may never be more accurate than it is now given the concentration of U.S. market indices, eventually the two must come together. Although the economy remains steady, we continue to believe it is more likely to weaken than improve.
On a positive note, the dominant market theme of AI investment appears relatively unabated despite the recent threat posed by Deepseek[4]. In fact, some evidence points to spending in this arena being even more “feverish” as start-ups are now financing their investments (which are often primarily Nvidia GPUs) with their Nvidia GPUs as collateral and tech companies are spending on talent at rates that would make NBA superstars (or maybe just their agents) blush. Recently Meta announced they planned to spend over $100B on cutting edge AI research.[5] While the aspirations are impressive, we continue to view all of this as evidence of increased competitive intensity amongst the largest Tech companies. This environment is in contrast to exactly what made these companies so magnificent historically – relatively unopposed dominance within their respective markets.
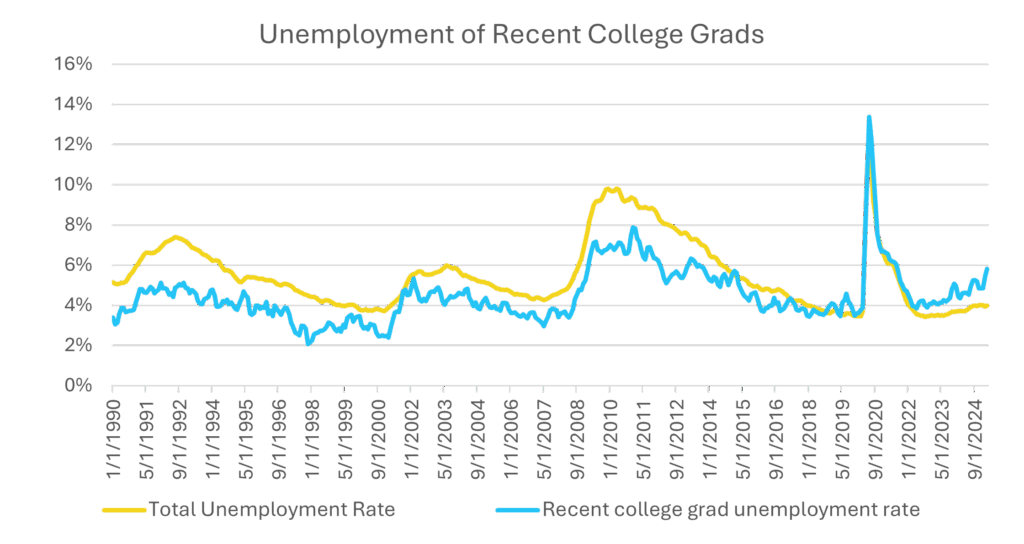
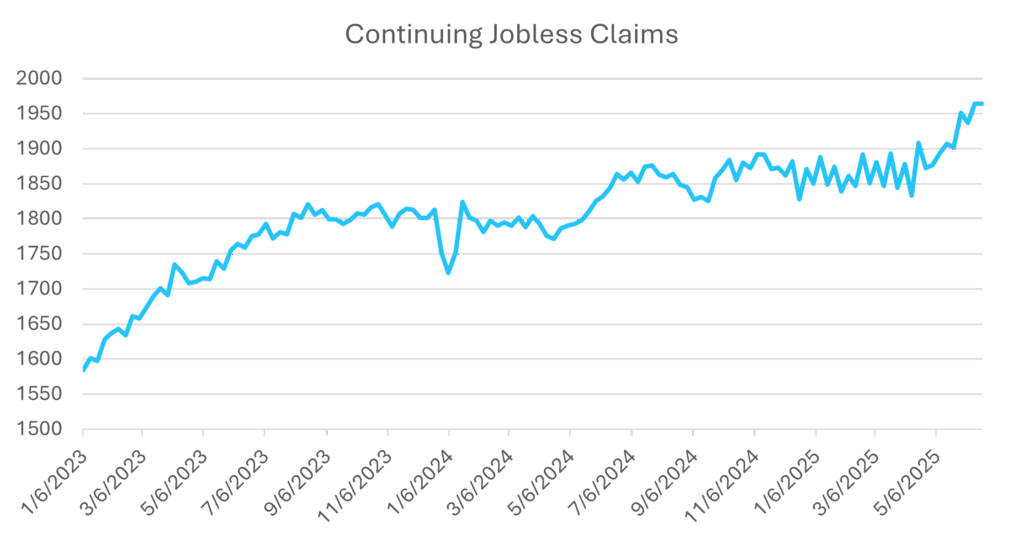
In looking for signs of economic weakness, our focus is on the labor market. We believe weakness in the labor market begets weakness in the economy in more permanent ways than any other economic signal. While unemployment remains historically low, a few data points are concerning:
1. College graduates are facing increasing unemployment rates. College graduates are often a good investment for companies and typically are employed at a higher rate than the aggregate labor force. The recent increase in graduate unemployment may hint at economic weakness or the unwillingness of companies to invest at the moment.
2. Jobless claims are increasing. While a blip on the longer-term trend, the near-term trend is clear and accelerated into the spring. This may indicate that although companies are not laying off employees it is increasingly more difficult to find a new job.


3. Construction market weakness. One potential reason why the labor market didn’t weaken during the rate hiking cycle of 2022, as many expected it would, was due to the strength of construction markets. Homebuilders were historically competitive against limited listed inventory and had large backlogs fueling a strong building cycle. In addition, non-residential construction was extremely strong post-Covid. Now both appear to be weakening. The residential housing market looks to be in a precarious position as new home inventory has reached the highest level since the housing crisis of 2008[6]. This comes amid minimal signs of mortgage rate relief and is persisting despite historically low competition from existing homes. At the same time, non-residential construction has turned negative. This has almost never occurred outside of recessions, and it’s happening despite record data center growth contributing billions in spend.[7]
Investing in an uncertain future.
While the fundamental picture is murky, risk markets remain technically very strong. This warrants a flexible approach. We view the overall risk/reward in U.S. equity markets as increasingly unfavorable and hinging on the following questions:
- Is the economy likely to get stronger or weaker?
- Can AI-related spending sustain its current growth rate?
- And finally, are investors discounting these risks appropriately?
Of these three market-driving questions we have opinions on two but a high degree of confidence that the answer to the final question is No.
However, as a quant model, if technical strength remains, we don’t need to wait around for the market to prove us right or wrong. Our recent reduction in risk was not predicated on any specific forecast about future outcomes, but rather on the short-term dynamics following a sharp pullback and recovery. If market strength continues in an orderly fashion, we’ll likely see our risk exposure increase. Conversely, if markets start to price in some of the potential risks on the horizon, we may further reduce risk exposure.
At the moment, our system is most comfortable betting on international equities, which may prove to be a lasting trend, an area where most investors likely find themselves underexposed. With investor complacency so high, now is the perfect time to examine your overall risk levels versus whatever each respective plan requires. If we can be helpful in any way, please don’t hesitate to reach out.
Contact us to discuss strategies that have the potential to navigate this market.
[1] Bloomberg. The drawdown occurred from 02/20/25 to 04/08/25
[2] Bloomberg data, the S&P 500 returned -0.7%, while the ACWI index returned 0.92% for the period 3/31/2025-4/30/2025
[3] “Liberation Day” referenced here is April 2, 2025, the day Trump announced a broad U.S. tariffs.
[4] In January Chinese firm Deepseek released a white paper showcasing a cutting edge Large Language Model which they demonstrated they built without the most cutting edge training chips and far less of them. For a brief period of time the market punished every company in the semiconductor supply chain under the expectation that models would become more efficient over time, this is in stark contrast to the prevailing attitude that more compute directly equaled better models.
[5] https://www.ainvest.com/news/meta-ai-infrastructure-plans-100s-billion-investment-achieve-superintelligence-2507/
[6] There were 115,000 new homes for sale as of 5/30/2025 the highest rate since, 8/31/2009. Source: U.S. Census Bureau.
[7] US Census Bureau US Private Construction spending declined 3.9% year over year ending 5/31/2025. In that time data center construction spending increased 25% to over 5% of all construction in the U.S.
Disclosures:
Copyright © 2025 Algorithmic Investment Models LLC. All rights reserved. All materials appearing in this commentary are protected by copyright as a collective work or compilation under U.S. copyright laws and are the property of Algorithmic Investment Models. You may not copy, reproduce, publish, use, create derivative works, transmit, sell or in any way exploit any content, in whole or in part, in this commentary without express permission from Algorithmic Investment Models.
Certain information contained herein constitutes “forward-looking statements,” which can be identified by the use of forward-looking terminology such as “may,” “will,” “should,” “expect,” “anticipate,” “project,” “estimate,” “intend,” “continue,” or “believe,” or the negatives thereof or other variations thereon or comparable terminology. Due to various risks and uncertainties, actual events, results or actual performance may differ materially from those reflected or contemplated in such forward-looking statements. Nothing contained herein may be relied upon as a guarantee, promise, assurance or a representation as to the future.
This material is provided for informational purposes only and does not in any sense constitute a solicitation or offer for the purchase or sale of a specific security or other investment options, nor does it constitute investment advice for any person. The material may contain forward or backward-looking statements regarding intent, beliefs regarding current or past expectations. The views expressed are also subject to change based on market and other conditions. The information presented in this report is based on data obtained from third party sources. Although it is believed to be accurate, no representation or warranty is made as to its accuracy or completeness.
The charts and infographics contained in this blog are typically based on data obtained from third parties and are believed to be accurate. The commentary included is the opinion of the author and subject to change at any time. Any reference to specific securities or investments are for illustrative purposes only and are not intended as investment advice nor are they a recommendation to take any action. Individual securities mentioned may be held in client accounts. Past performance is no guarantee of future results.
As with all investments, there are associated inherent risks including loss of principal. Stock markets, especially foreign markets, are volatile and can decline significantly in response to adverse issuer, political, regulatory, market, or economic developments. Sector and factor investments concentrate in a particular industry or investment attribute, and the investments’ performance could depend heavily on the performance of that industry or attribute and be more volatile than the performance of less concentrated investment options and the market as a whole. Securities of companies with smaller market capitalizations tend to be more volatile and less liquid than larger company stocks. Foreign markets, particularly emerging markets, can be more volatile than U.S. markets due to increased political, regulatory, social or economic uncertainties. Fixed Income investments have exposure to credit, interest rate, market, and inflation risk. Diversification does not ensure a profit or guarantee against a loss.
The S&P 500 Index measures the performance of 500 large U.S. companies across various industries and is weighted by market capitalization, giving larger companies greater influence on the index. MSCI Emerging Markets Index: The MSCI Emerging Markets Index is an unmanaged index that measures equity market performance in global emerging markets and is not available for direct investment. MSCI EAFE Index: The MSCI EAFE Index is an unmanaged index that tracks the performance of developed markets outside of the U.S. and Canada and is not available for direct investment. The FTSE China 50 Index is an unmanaged index that tracks the performance of the 50 largest Chinese companies listed on the Hong Kong Stock Exchange and is not available for direct investment.
The S&P 500 Equal Weight Index includes the same companies but assigns each an equal weight, offering a better representation of the “average” stock’s performance. The S&P Technology Sector Index focuses on technology companies within the S&P 500, heavily influenced by large-cap tech firms such as those in software, hardware, and semiconductors. The MSCI All Country World Index (ACWI) measures global equity performance, including both developed and emerging markets, providing a broad view of international stock markets. Finally, the S&P 10 refers to the ten largest companies in the S&P 500 by market capitalization, which can have an outsized impact on overall index performance due to their size. The CRSP US Large Cap Value Total Return (TR) Index tracks the performance of large-cap U.S. stocks classified as value-oriented, based on factors such as price-to-book ratios. The CRSP US Large Cap Growth TR Index represents large-cap U.S. stocks classified as growth-oriented, based on metrics such as earnings and revenue growth potential.
For Investment Professional use with clients, not for independent distribution.
Please contact your AIM Regional Consultant for more information or to address any questions that you may have.
Algorithmic Investment Models LLC (AIM)
125 Newbury St., 4th Floor, Boston, MA 02116 (844-401-7699)